The Campaign Dashboard brings your opportunity discoveries, market activity, and link history into one place. You can see what's changed, open the results behind the numbers, and decide what your team should look at next.
For example, imagine you're preparing a client review and the opportunity count has gone up. Open those results to see what was found. Then combine that with your team's notes to explain which opportunities you pursued and what happened.
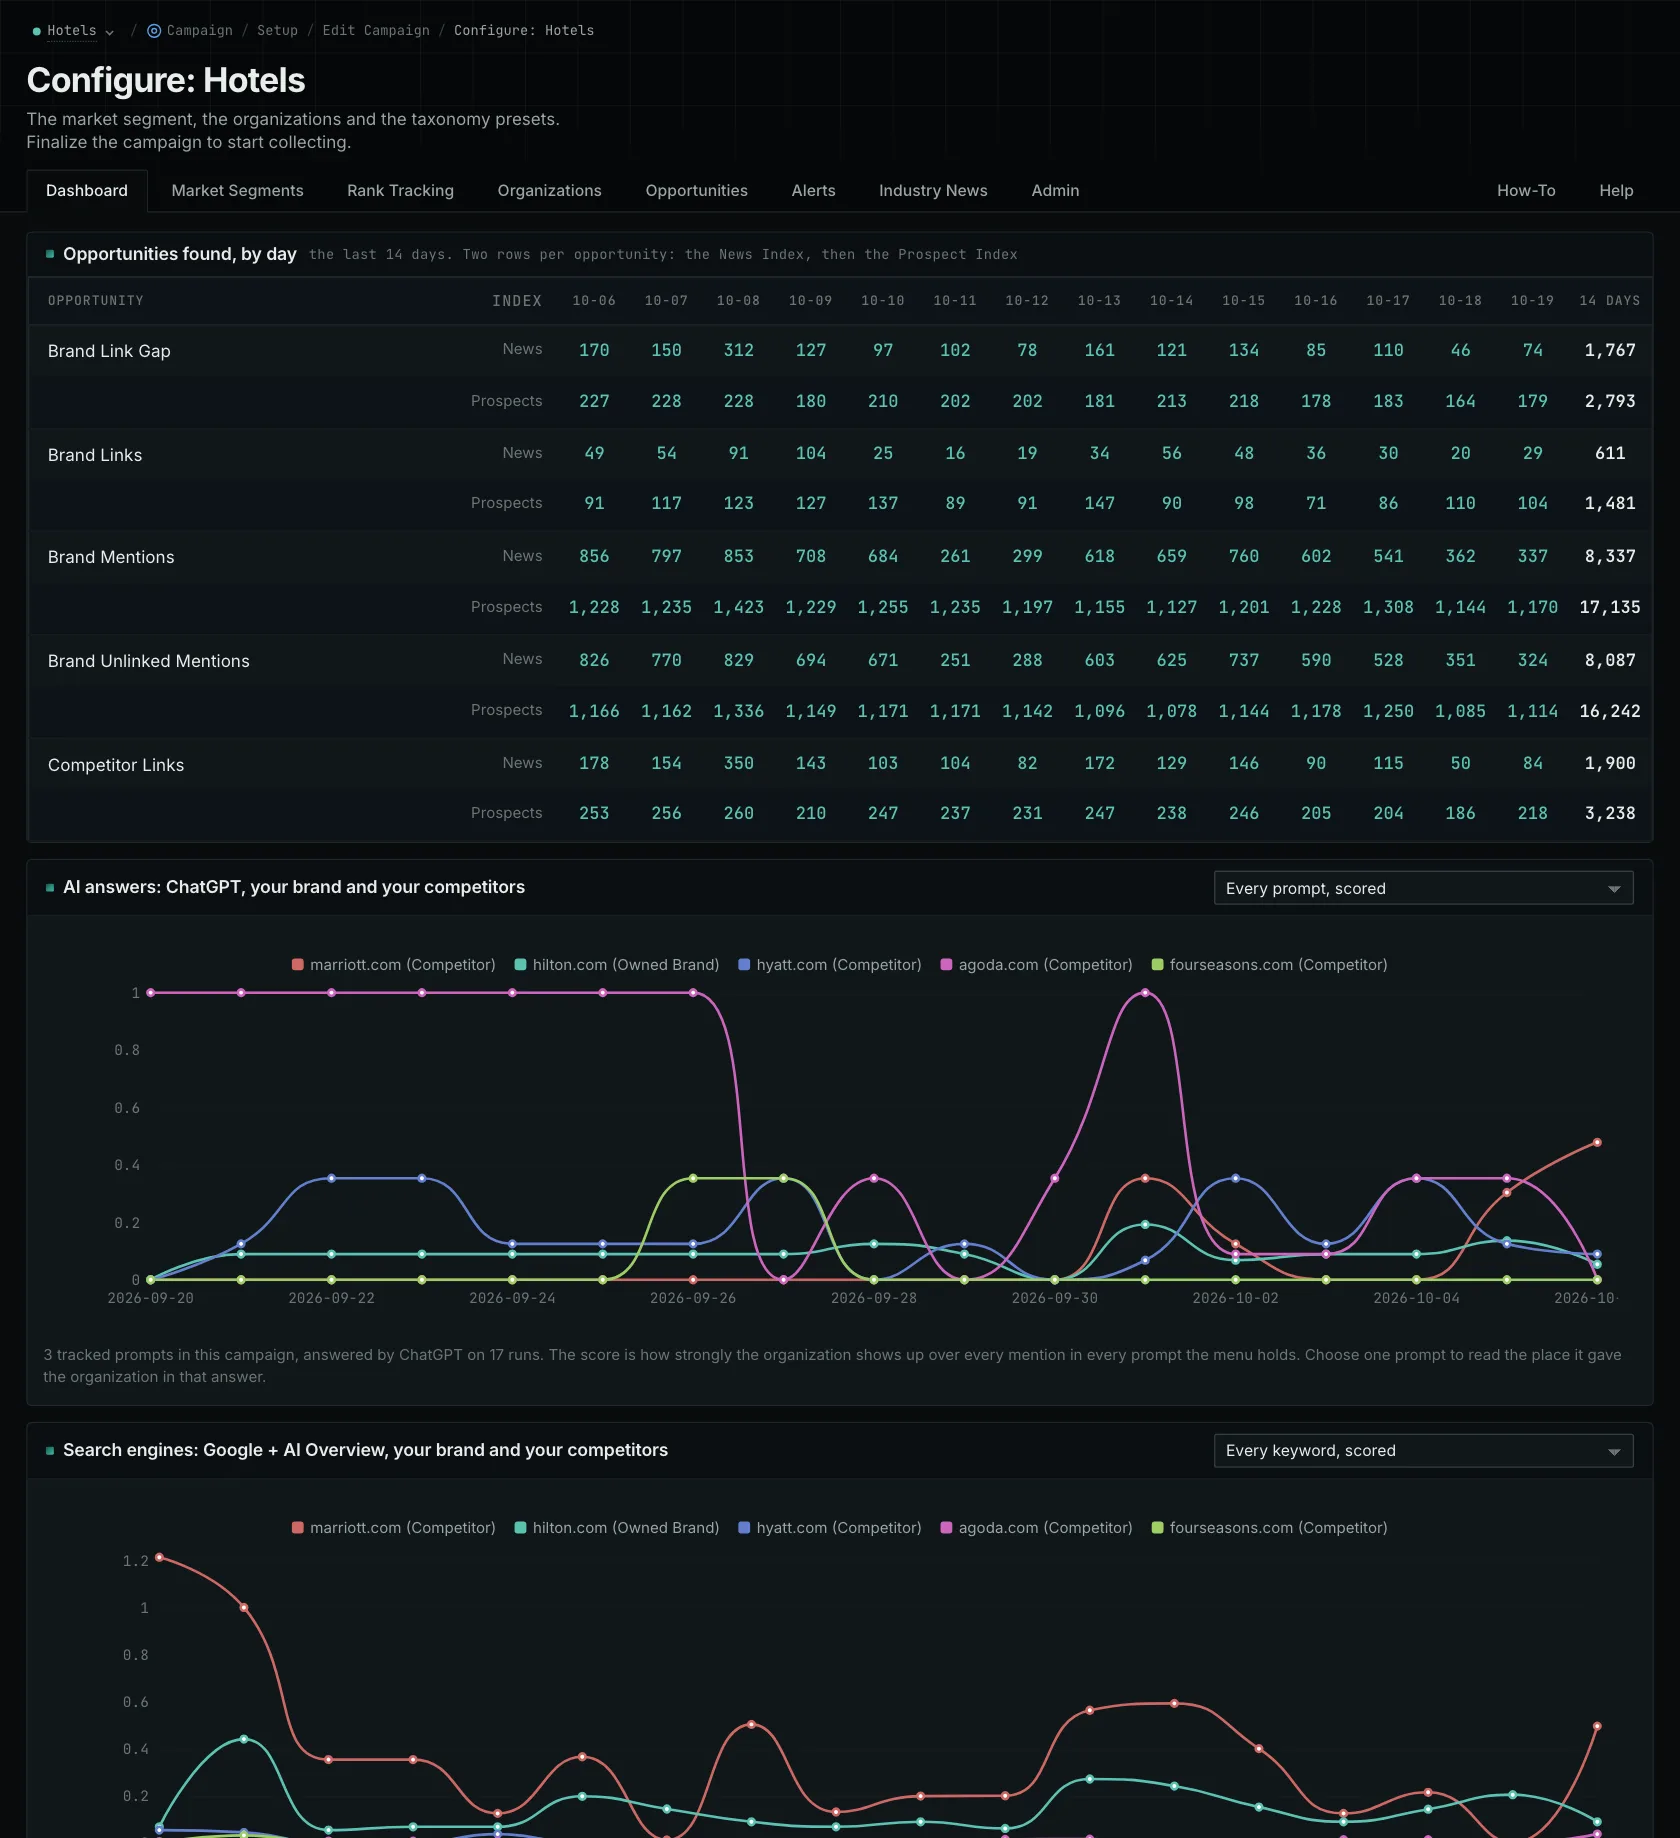
Open the opportunities behind the count
Each configured opportunity has separate News Index and Prospect Index rows for recent days. Select a count to open the matching pages from that index and day. If one is a directory, you can read its requirements and decide whether the client should apply.
The count tells you that a page was found as an opportunity. It could be an older directory that was collected for the first time. Keep your team's actions alongside that discovery, so you can show whether someone reviewed the requirements, applied, or got the business listed.
Zero means the search ran for that counting window and found no matches. A dot means that index wasn't counted for the day. Keeping those separate lets you explain which days were checked and which weren't.
Review the pages found for the client
The market charts show pages mentioning or linking to your brand and competitors. Compare the daily counts, then open the pages to see what was found.
When a client asks about a change in the counts, open the results for that day. Show which pages appeared and why they matter to the business.
The PageRank charts show link-graph history at Domain and Host levels. For each month, the Host chart uses the larger available value from the bare host and www host. If only one has a record, it uses that one. If neither does, it leaves a gap. Those records are combined in the Host chart.
Bring those findings into the review with the work your team has done. For a directory, show why it's relevant and whether you applied. For a mention, show what the page says about the business. The dashboard gives you the research results; your work records explain outreach, agreements, and sales.
Read more about reviewing client progress, monitoring opportunities, and setting up a campaign.
See how OppAlerts fits your work.
Tell me what you are working on and what you need to find out. I can walk you through the relevant reports and explain what OppAlerts can help you do.
You can explore the demo first, or use this form to ask about a task or arrange a demonstration with me.