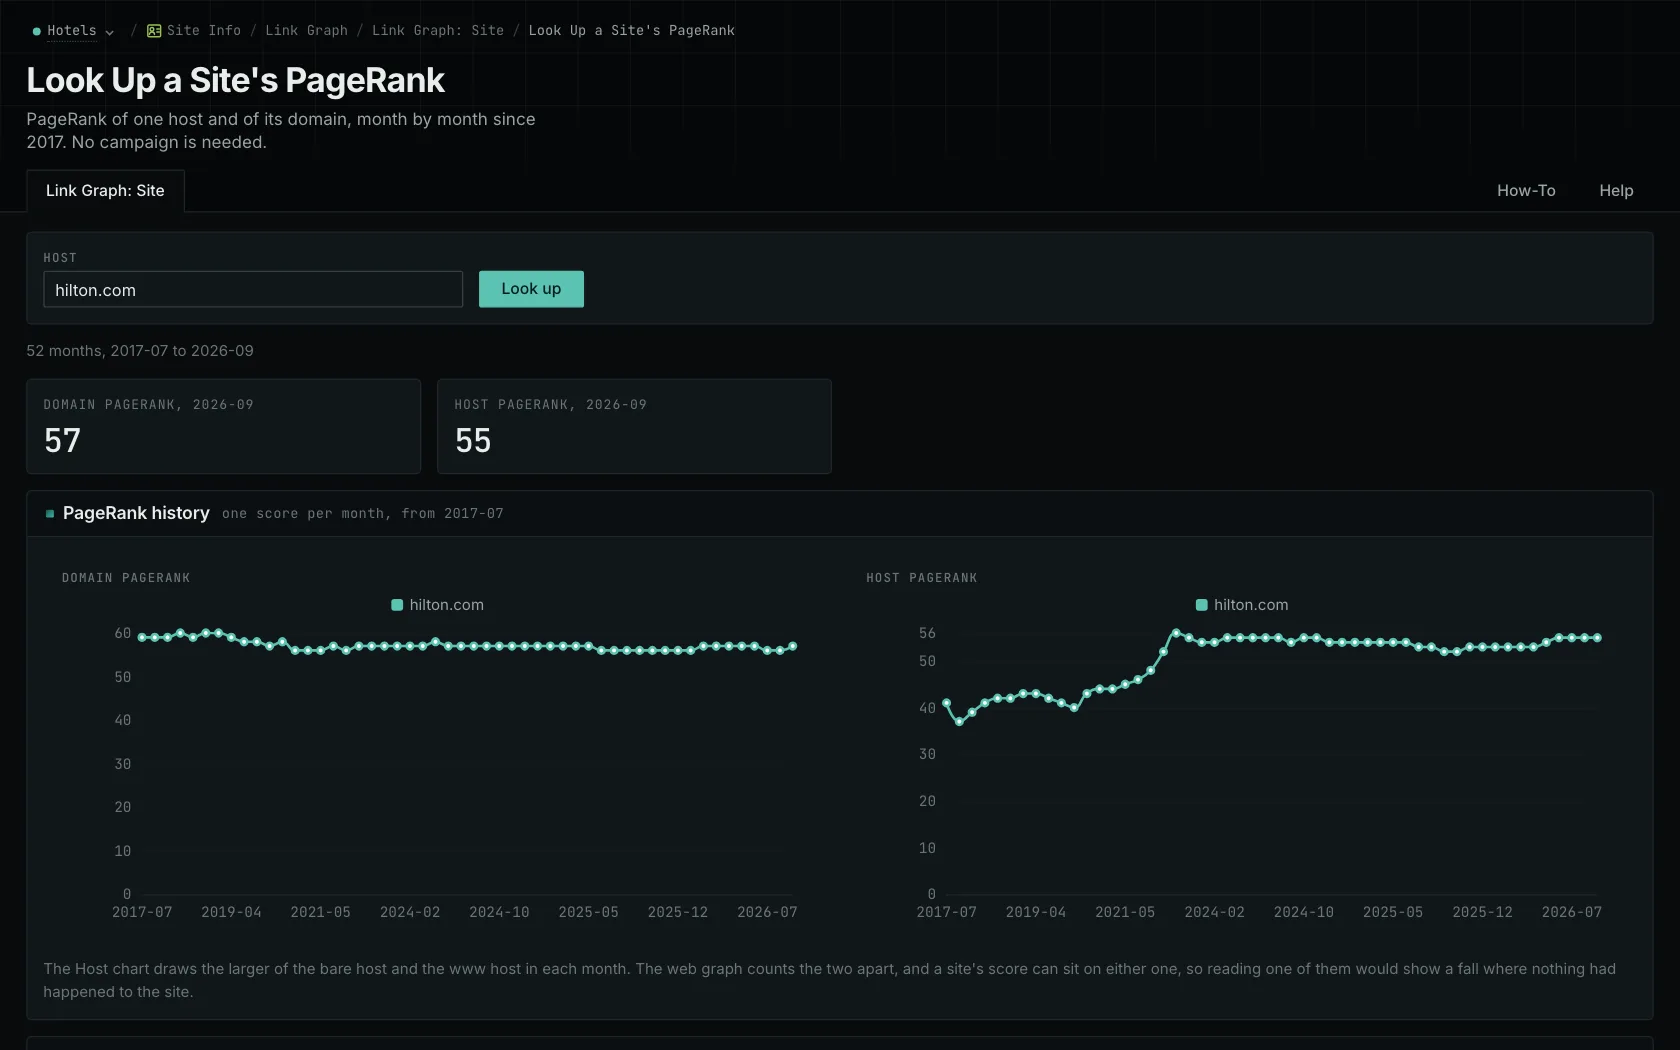
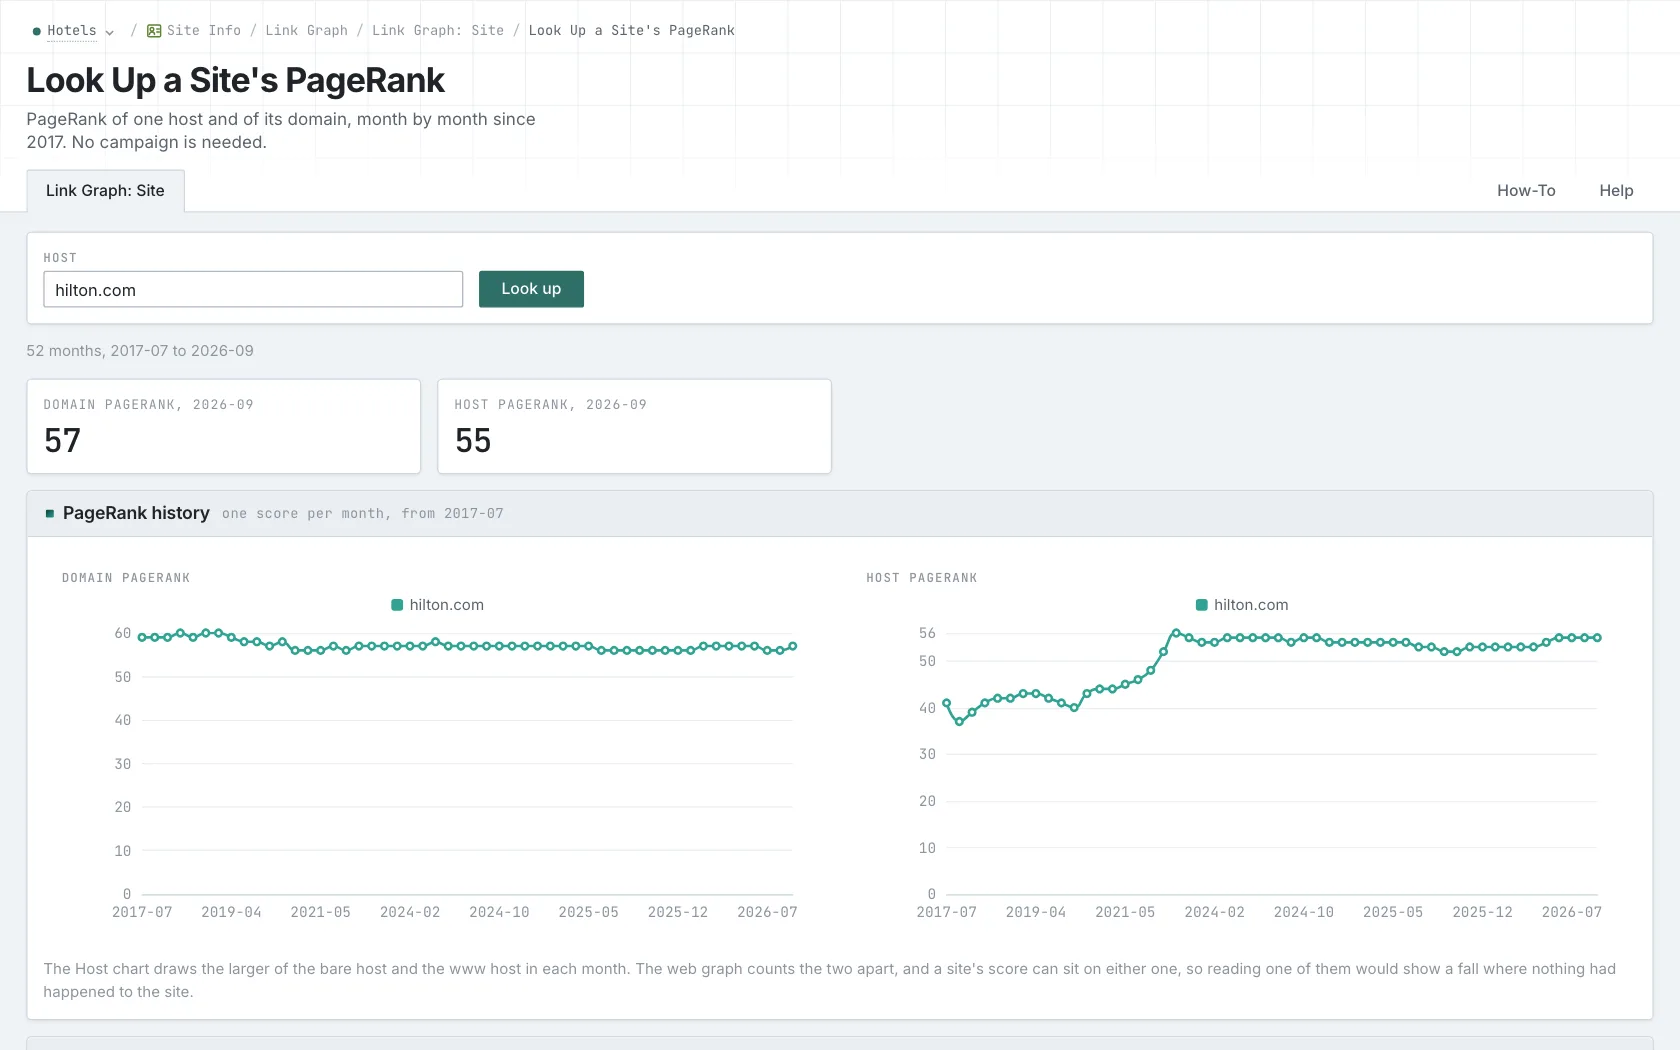
Two websites can have the same link measurement today and very different histories. One may have stayed there for years. Another may have just reached it, or fallen to it from an earlier high. PageRank history and PageRank over Time, or PRoT, help you see those differences when you're researching publishers.
That history gives you context. You still need to read the site to decide whether it serves your audience, accepts your contribution, and publishes good work.
Understand what the current number measures
PageRank is calculated from connections in a link graph, including the connections of the sites linking to you. In OppAlerts, it describes a host or domain within the measured dataset. PageRank is the name for a family of calculations. Read the value within its own dataset, where you have a common basis for comparison.
The number isn't a search engine's internal figure. It doesn't predict how an engine will treat the site or measure the quality of its articles. Use the link-based comparison alongside your investigation of those other questions.
Check which part of the site you're comparing
Link Graph shows Domain and Host PageRank. Domain describes the registrable domain. Host takes the larger available monthly value from the requested host and its www variant. A publication at blog.example.com remains separate from example.com. Choose the level that matches what you're reviewing.
The www handling matters when you read the history. From January 2026, the underlying graph records bare hosts and www variants separately. In one anonymized source example, the bare host measured 56 and www measured 0 through December 2025. From January 2026, the bare host measured 31 and www measured 56.
If you only looked at the bare host, you'd see a drop and miss the larger value recorded against www. The displayed Host series uses the larger available value for each month. If only one value is available, it uses that one. If neither was observed, it leaves a gap. A missing observation isn't a measured zero.
That explains the difference in the recorded hosts. It doesn't explain everything that happened to the website. Before treating a sudden movement as a change in the publication's value, check the date and the host records. The methodology guide explains the calculation.
Look at the months behind the latest value
A steady history, a sustained rise, and a peak followed by a decline could all end at the same number. They give you different things to investigate when you visit the site. Check whether recent articles are still relevant, whether the publication has changed direction, and whether a movement lines up with a change in the measured data.
The newest point is the latest completed monthly observation. A link obtained after that may not be represented yet. Read the current pages too, so you understand what's being published now alongside the stored history.
Understand what PRoT adds
PRoT adds together the PageRank values for every stored month. A higher total could come from higher monthly values, more months of history, or both. That's a different measure from the current value.
A site that recently increased could have a high current value and a lower accumulated total. Another could have high PRoT despite a recent decline. Read the monthly history to see which situation you're looking at before deciding what it means for a placement.
You can filter opportunity and brand page reports by minimum domain or host PRoT. Link Graph pages show PageRank only. Use the filter to narrow the candidate list, then inspect the monthly series behind each candidate's total.
If two sites have similar current values, their histories help you decide what changes to investigate. Then use their current audience, content, and submission requirements to judge whether your contribution fits. Follow a history-review walkthrough or continue with the prospect-evaluation guide.
See how OppAlerts fits your work.
Tell me what you are working on and what you need to find out. I can walk you through the relevant reports and explain what OppAlerts can help you do.
You can explore the demo first, or use this form to ask about a task or arrange a demonstration with me.