I analyzed backlinks and brand mentions across 100 industries, 16 LLMs, ChatGPT's web interface, and the brands named in Google's AI Overviews, using four taxonomies and tens of millions of pages.
The main results:
- All 21,600 similarity curves passed the relevance test. Pages linking to or mentioning recommended brands scored higher against the most closely related quarter of categories than against the least related quarter.
- Relevant backlink count had the strongest correlation with AI score across all 17 AI channels. For GPT-6 Astra, the average correlation within industries was 0.57, and it was positive in all 100 industries.
- Unlinked mentions followed the same relevance pattern. Their counts correlated with GPT-6 Astra's AI scores at 0.41, compared with 0.55 for total backlink counts.
If you haven't watched the video yet, I highly suggest watching it before you read the rest of this. It's only 12 minutes. I explain how LLMs work, how they generate their responses, and why this research is different from the research you've seen before. The rest of this post will make a lot more sense after you've seen it.
Subscribe to OppAlerts on YouTube
Here, I'll walk through how I ran the tests, the results, and what they mean for your campaigns.
How I put the research together
Ask for recommendations, then combine the answers
Many of you are familiar with the two AI Search Visibility reports I released in May1 and July2 of this year.
I used the same 100 industries from the July report.
For each industry, I asked for the top 25 recommendations, 25 times, in 25 slightly different ways. For example:
- “What are the 25 best hotels and resorts in the United States?”
- “List the top 25 hotel and resort brands in the United States.”
That's 2,500 prompts. None names a brand, a persona, a city, or a price. Each asks for website domains, one per line, with the most recommended first.
I sent those prompts to 13 OpenAI models, from gpt-4o-mini through gpt-6-sol; three Google models, gemini-3.6-flash, gemini-3.7-flash, and gemini-3.8-flash; and ChatGPT through the web interface.
That's 16 LLMs through their APIs, plus ChatGPT web: 17 AI channels. The API tests used the models without web search. ChatGPT's web interface can search before answering.
I also ran the questions through Google and kept three separate lists: the organic results, the domains cited by AI Overviews, and the brands named by AI Overviews.
Those last two are different things. An AI Overview can recommend a hotel while citing a publisher that wrote about it.3 I wanted to look at both.
One answer isn't enough to get a useful ranking. Ask again and the list can change.4 So I combined all 25 answers for each industry and model, scoring each domain by how often it appeared and how high it appeared:
- Position 1 gets 1 point.
- Position 2 gets 1/2 point.
- Position 3 gets 1/3 point, and so on.
Add those up across the 25 answers and you have the domain's AI score.5 Sort by that score and you have its AI rank. A domain named first every time scores 25. A domain named once, in position 20, scores 0.05.
This is also why a list can have more than 25 brands. The answers don't all recommend the same ones. One gpt-4.1-nano list reached 571 domains.
Across all the answers, I collected 117,453 different domains. The analysis in this post uses up to the top 100 from each list: 55,862 domains, representing 70,003 combinations of domain and industry.
Some models give much shorter lists. GPT-6 Astra's median is 51 brands, and only eight of its industry lists reach 100. GPT-4o Mini fills 100 places in almost every industry. Keep that in mind when we get to the bottom of the charts.
Find the pages linking to and mentioning those brands
OppAlerts has two search engines it maintains.
One is for news, including news sites, blogs, and podcasts.6 It lets users monitor brands, competitors, and content relevant to their industry.
The other is for link and marketing opportunities: guest posts, product reviews, events, sponsorships, resource pages, etc.
Every page in both indexes already has an embedding of its main content. Each one is a list of 768 numbers.
So I had the recommendations, and I had the content and embeddings needed to look at their backlinks.
I searched the indexes for three sets of pages:
- Backlinks: pages that link to the domain. The analysis includes 28.4 million pairs of pages and brands: 9.7 million from the news index and 18.7 million from the prospect index.
- Brand mentions: pages that name the brand, whether or not they also link to it. This includes 56.2 million pairs of pages and brands.
- Unlinked mentions: pages that name the brand without linking to it. This includes 50.1 million pairs of pages and brands.
These are pairs because one page can link to or mention several brands. A page linking to Marriott and Hilton counts once for each.
Getting the brand names was its own piece of work. I drafted a name for each domain, checked it against the homepage title, and ran mention searches for 44,600 brand names. Brands that weren't searched are excluded from the mention analysis.
For 242 of the largest combinations of brand and index, the backlink search returned more than 50,000 pages. I scored the first 50,000 and kept the full count for the page totals. Across all brands, the full searches returned 136.5 million backlink matches.
Unless I say otherwise, the charts combine the news and prospect indexes. I also checked them separately, which I'll come back to.
Figure out what those pages are about
Thankfully, other people have already spent a lot of time figuring out useful sets of business and content categories.
Those sets are called taxonomies.
I used four of them, from three different organizations, so that the research wouldn't depend on one organization's way of categorizing the world.
| Taxonomy7 | Categories | Published by |
|---|---|---|
| Google Ads Topics | 2,558 | |
| IAB Content | 704 | IAB Tech Lab |
| IAB Ad Product | 583 | IAB Tech Lab |
| NAICS | 2,125 | US Census Bureau |
| All four | 5,970 |
For every page, I compared its embedding with the embedding of every category.8 That gives me 5,970 similarity scores per page.
Most of the charts below use Google Ads Topics, the largest taxonomy.
For the hotel industry, its closest category is “Hotels & Accommodations.” I put that on the left, then sort the other 2,557 categories by how similar they are to it. “Hospitality Industry” is nearby, along with other travel categories. At the far right is the least similar category, “Laser Vision Correction.”
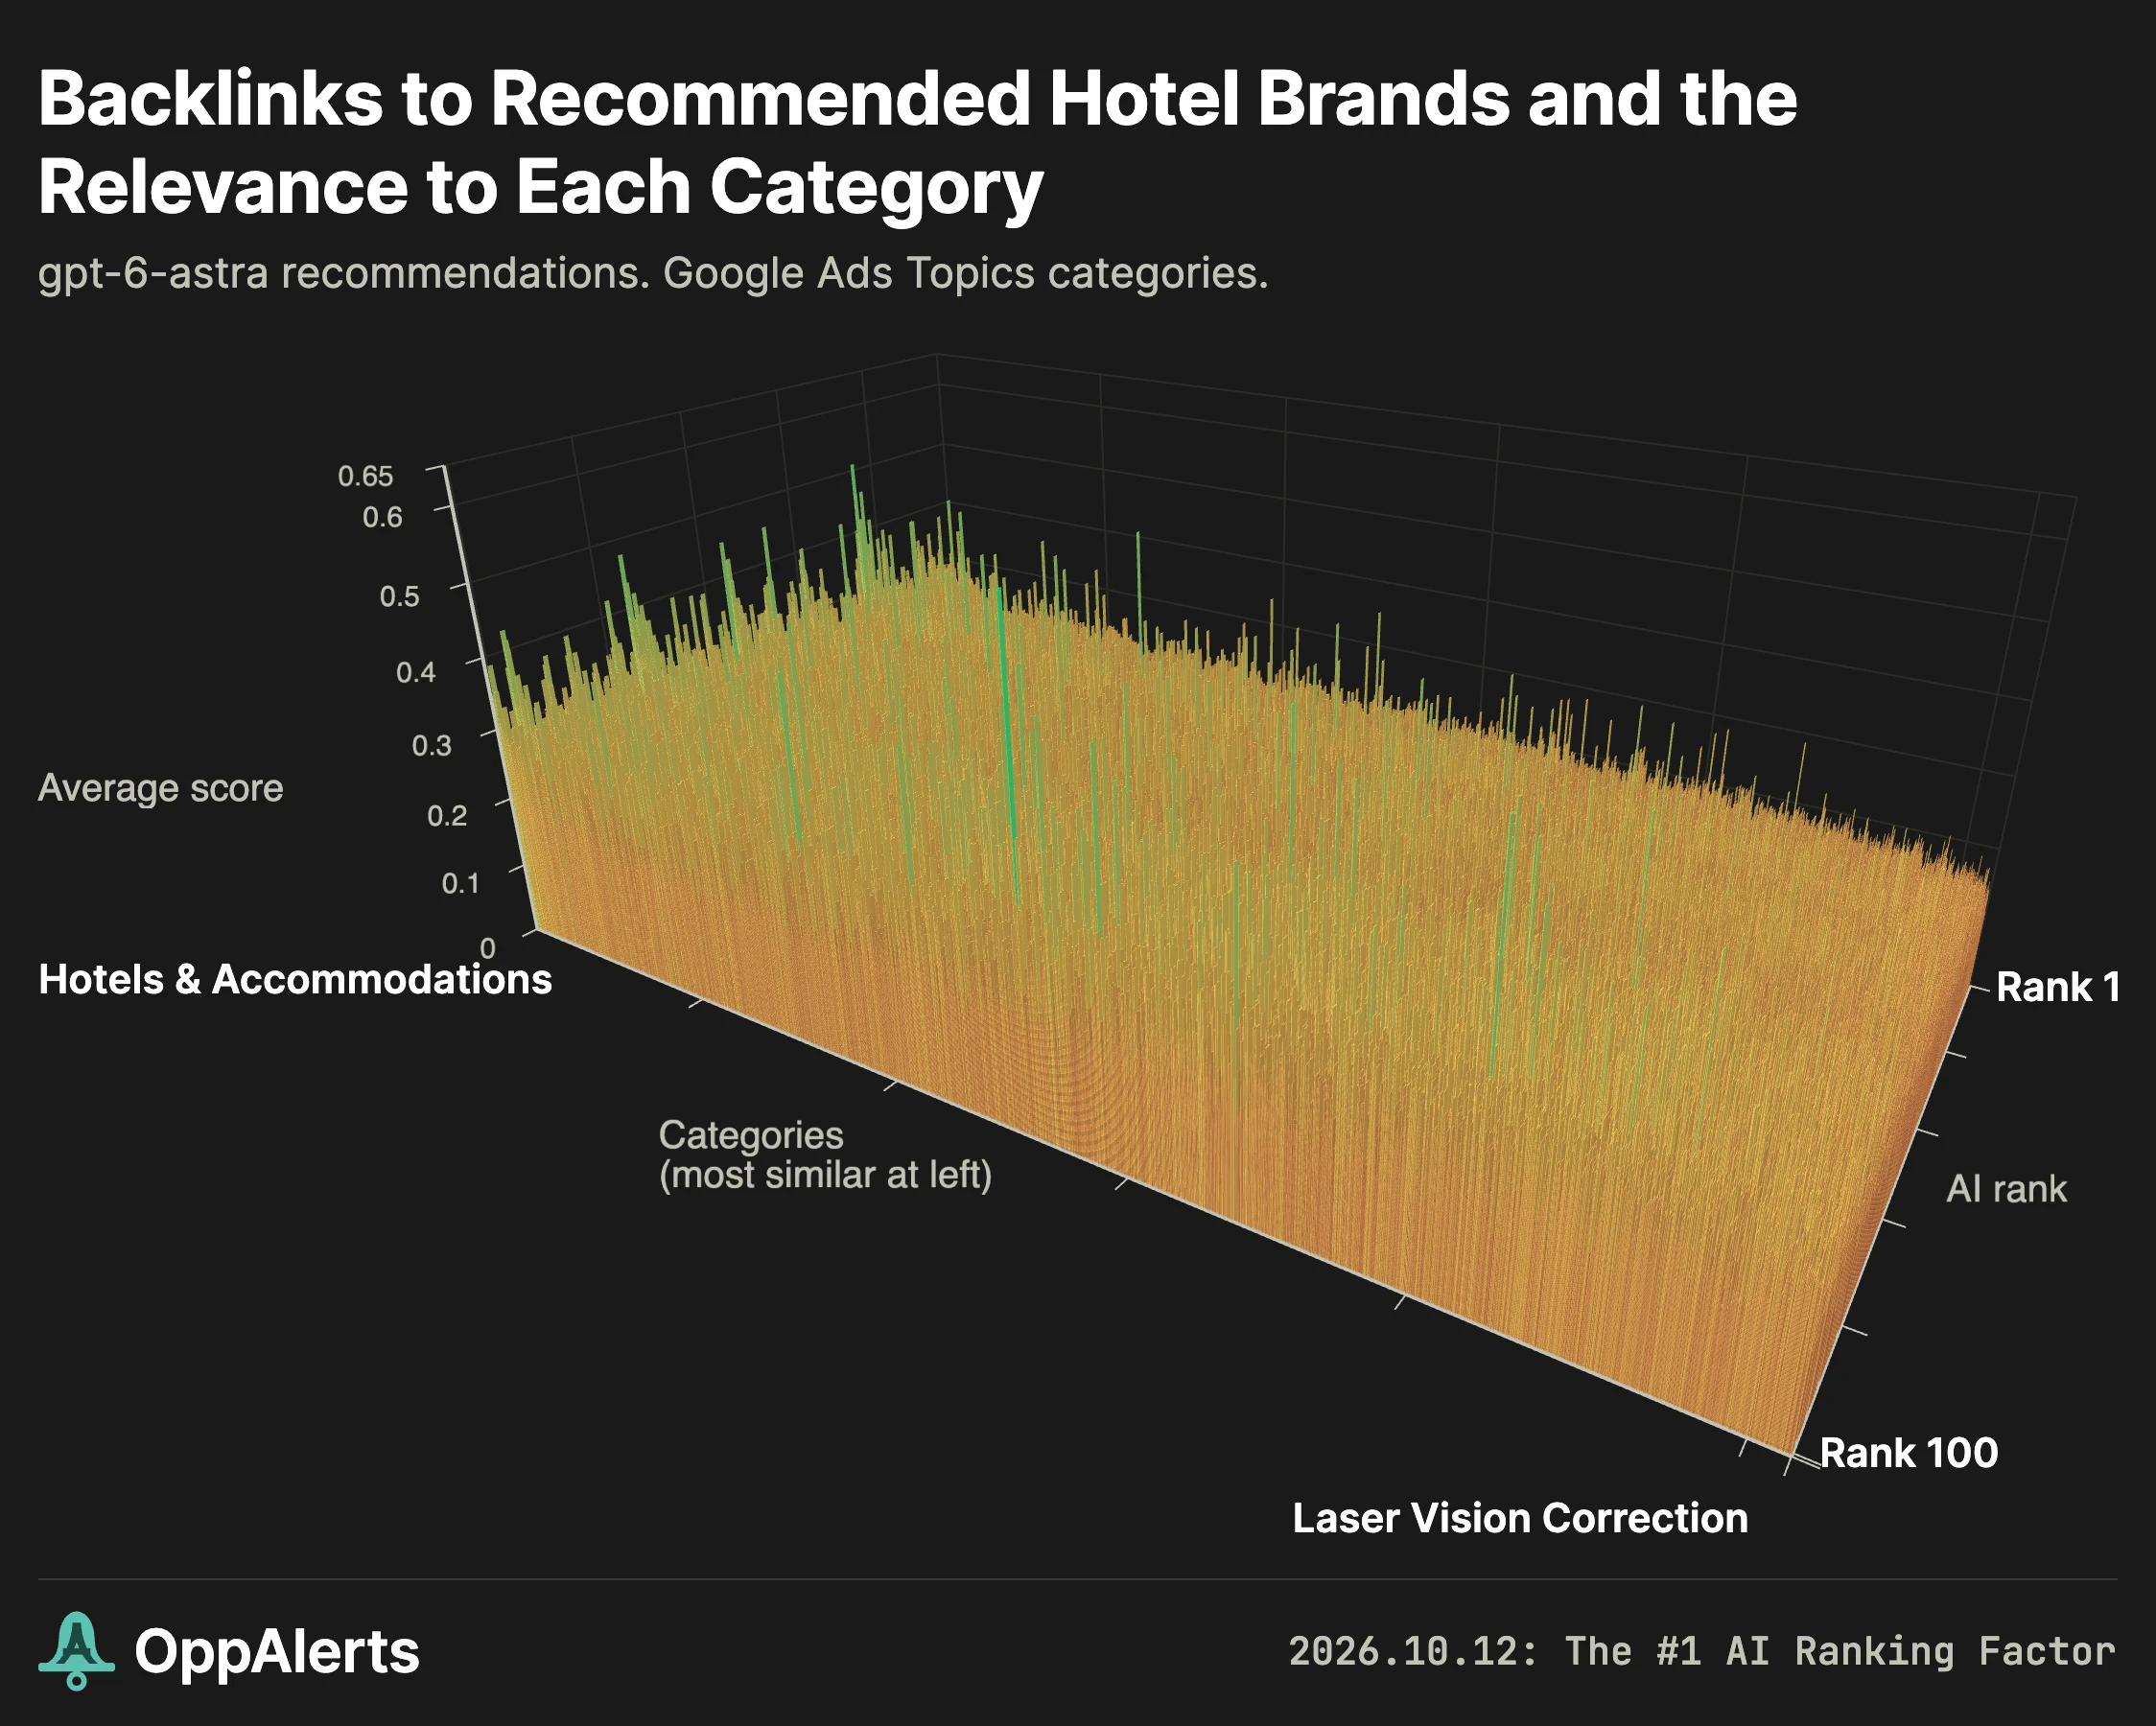
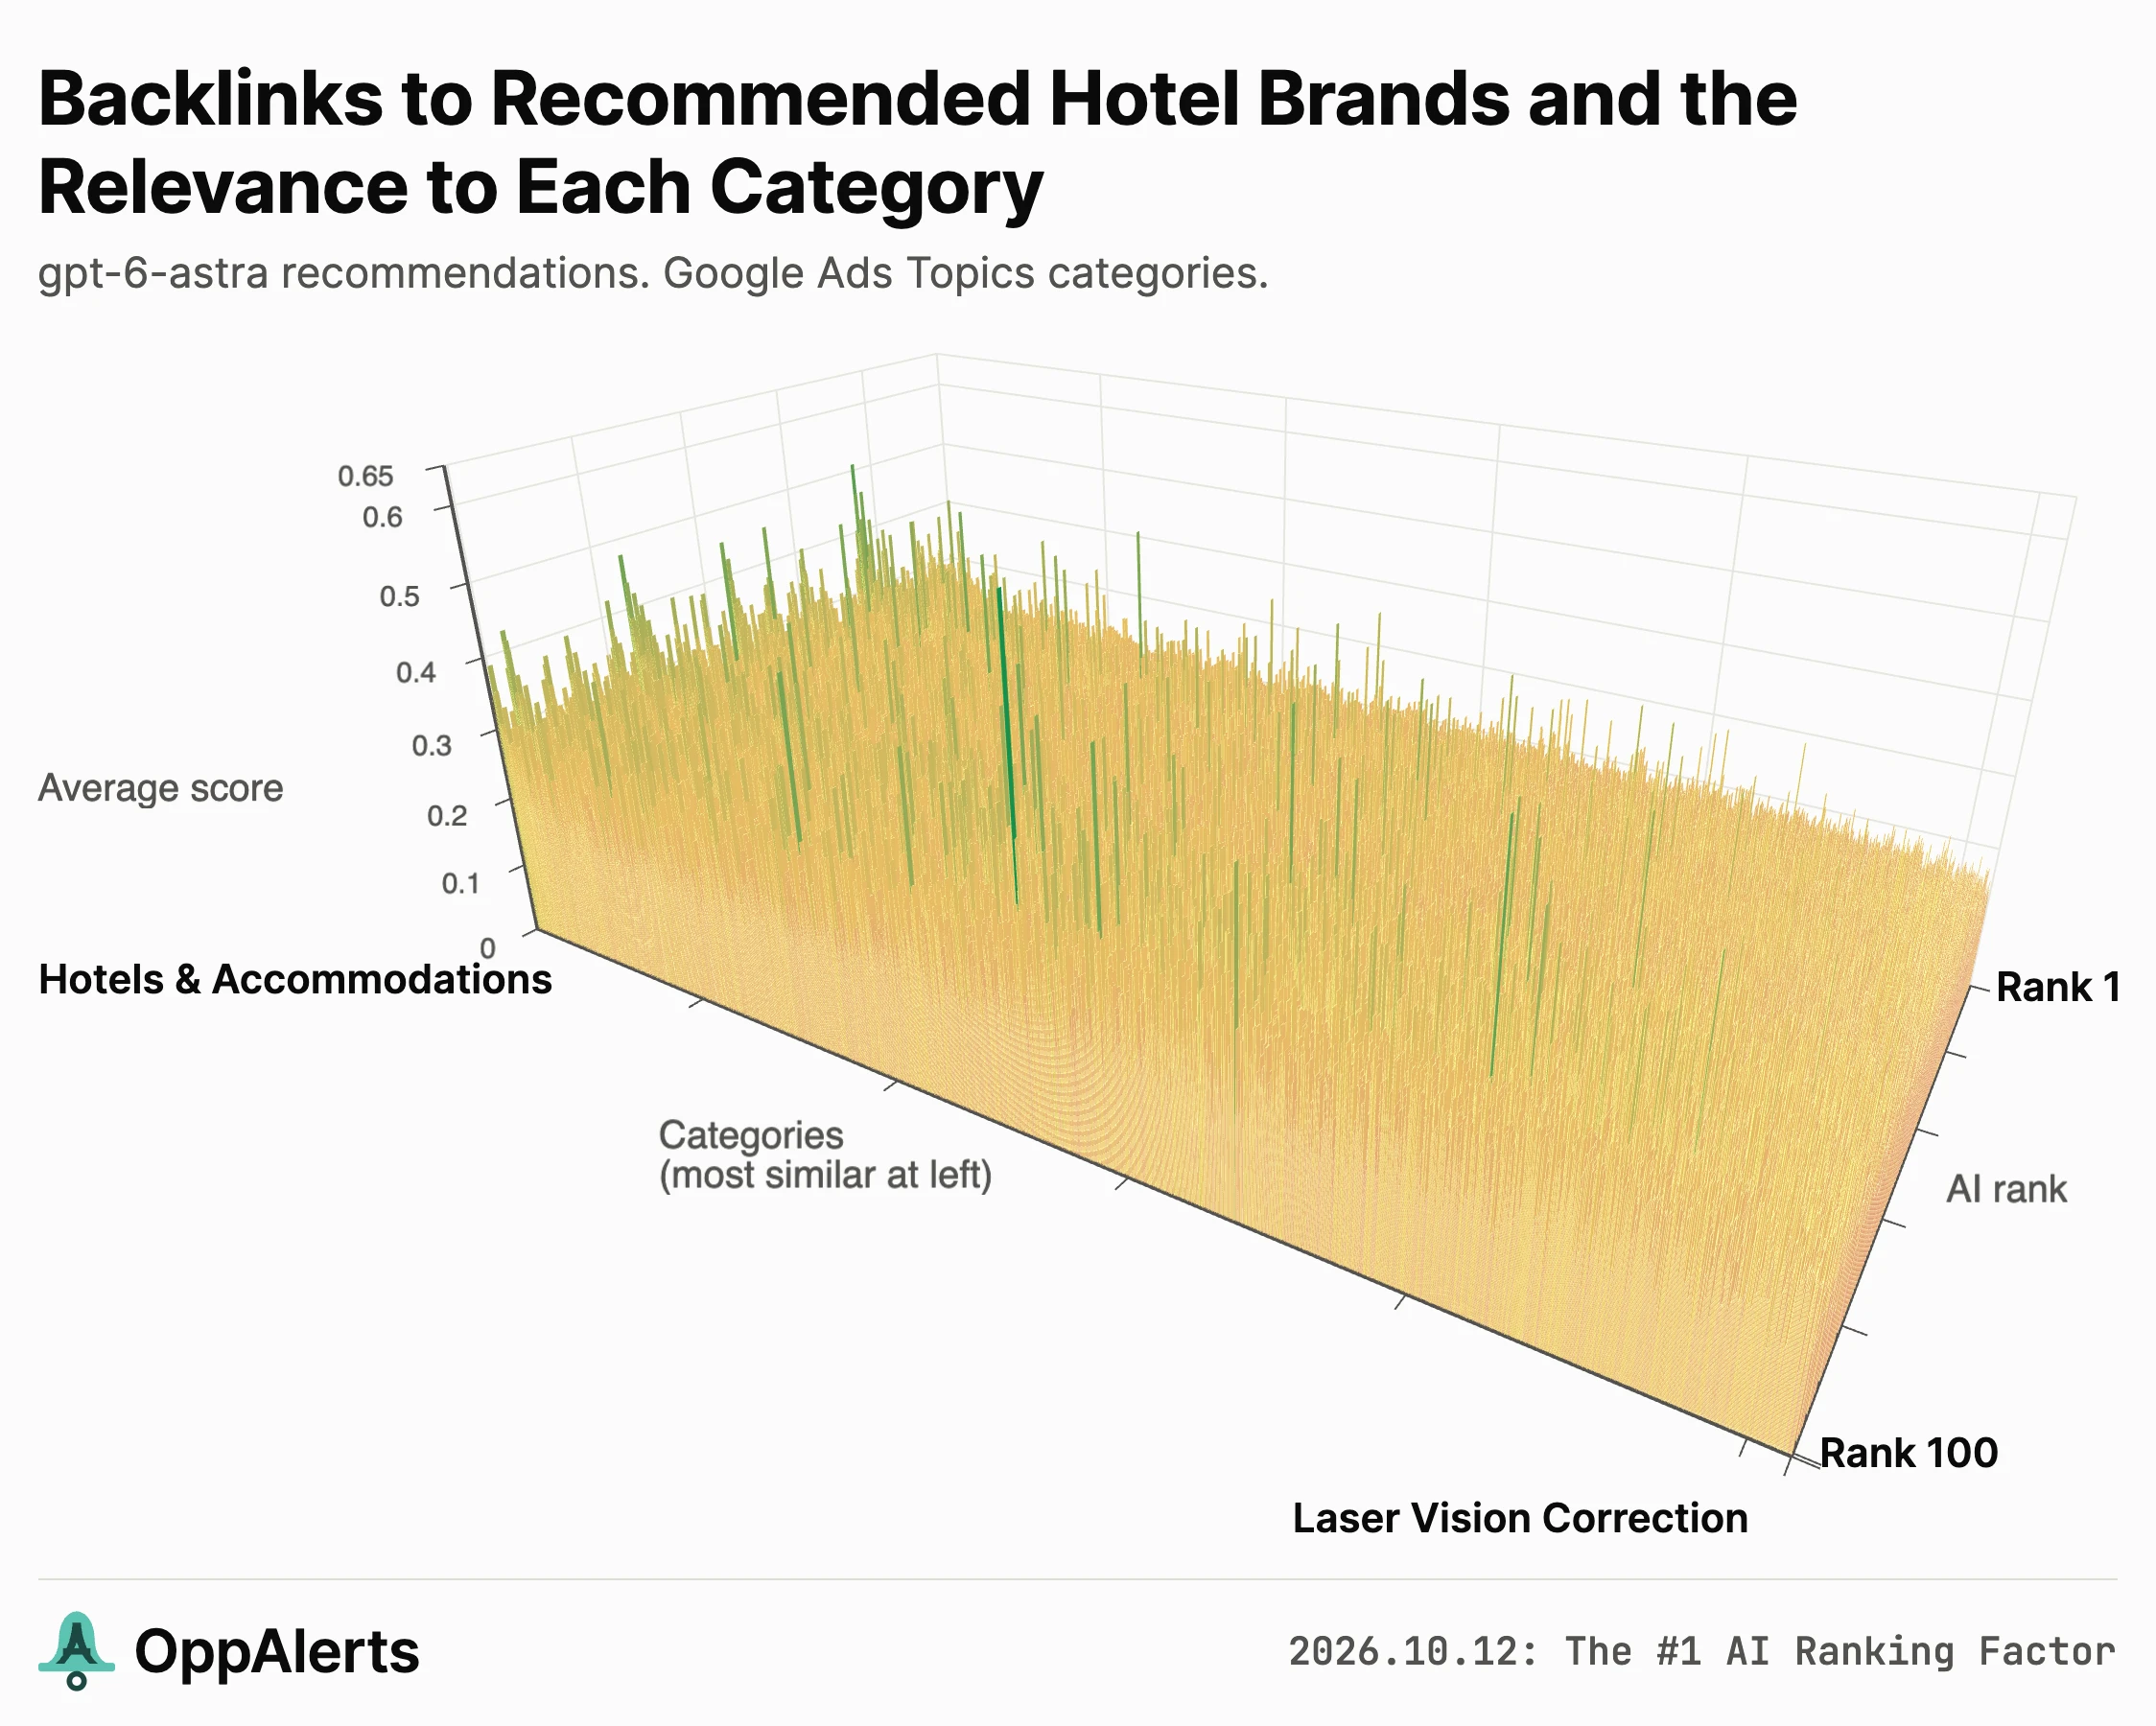
Now I can take Marriott's backlinks, average their scores for each category, and see what Marriott's backlink profile looks like.
Then I can do the same for the second recommendation, the third, and all the way down the list. And then repeat that for the other industries and models.
Add PageRank and PageRank over time
I also have PageRank records for these domains going back nine years, from July 2017 through September 2026. Of the full set of 117,453 domains, 86,053 have PageRank records.
The PageRank used here is a domain-level score on a scale from 0 to 100.9
PRoT, or PageRank over time, adds up a domain's PageRank across all of those records. It represents how long and how well a site has been established. A site that held a PageRank of 40 for nine years will have a much higher PRoT than a site that only reached 40 last year.
PRoT doesn't necessarily mean trust. But it wouldn't be much of a stretch to think of it as something like a trust factor.
That gives us a way to look at how established a site is, along with its current PageRank.
What the backlink content shows
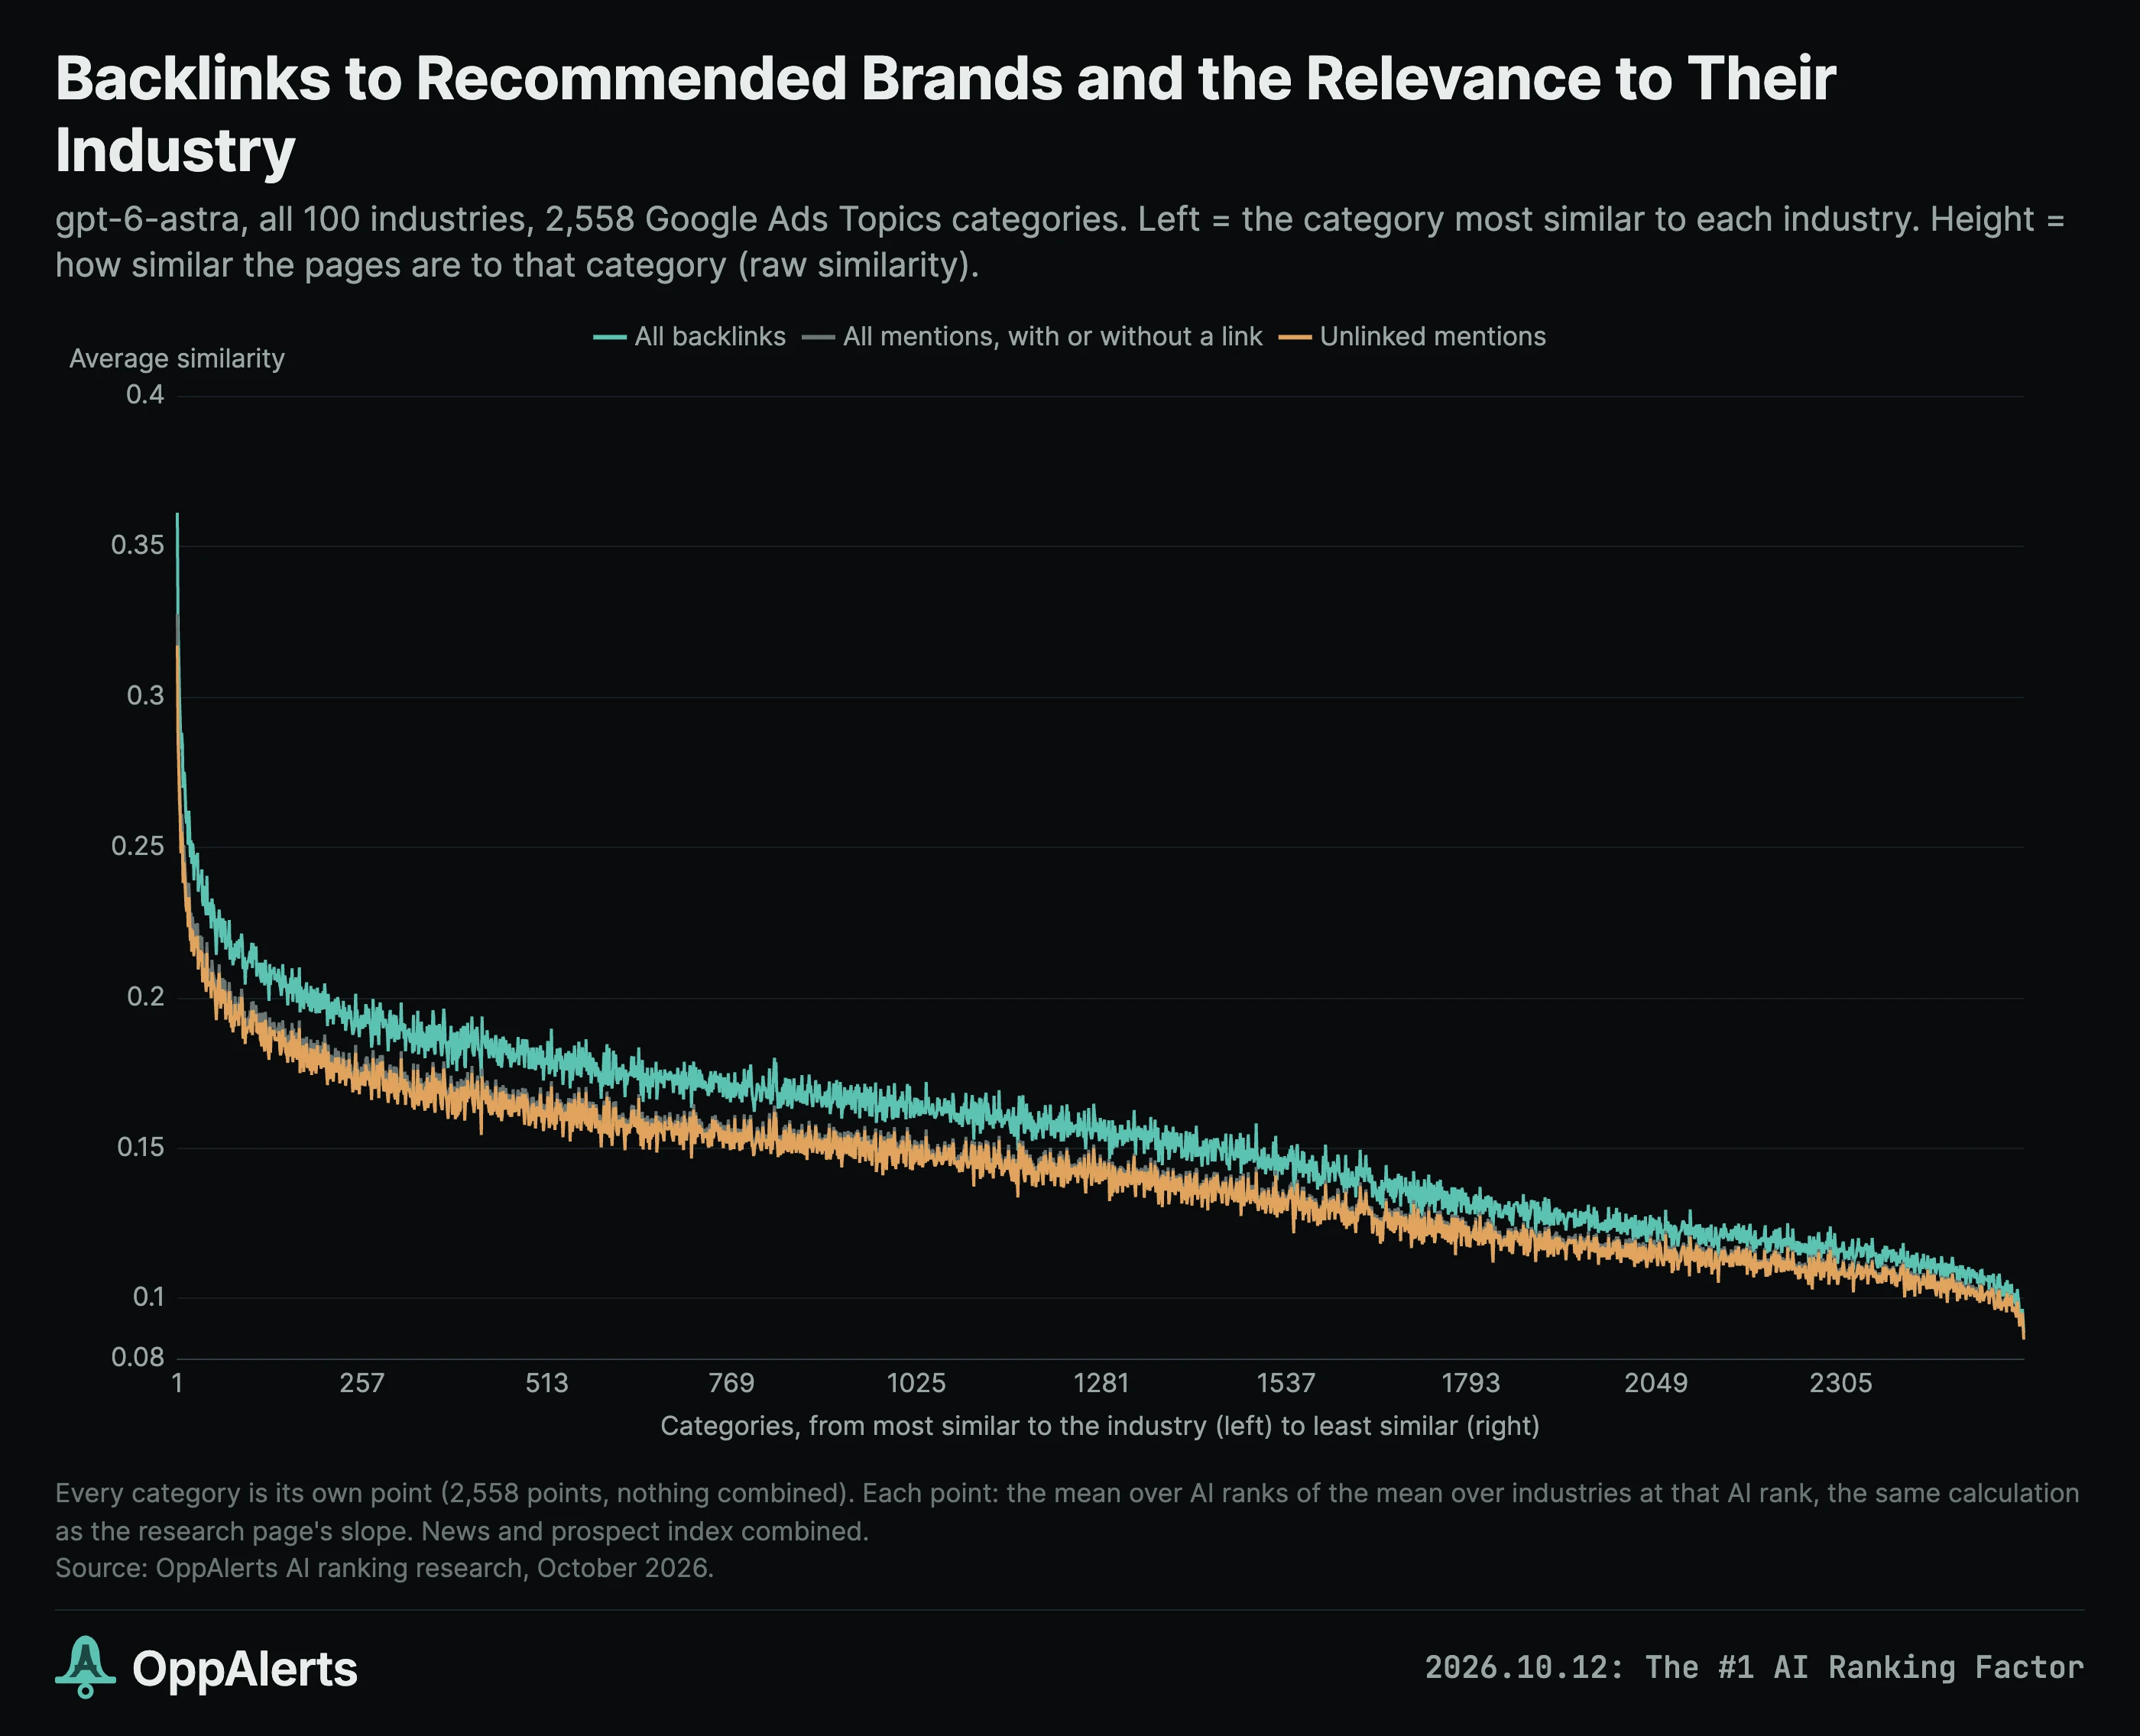
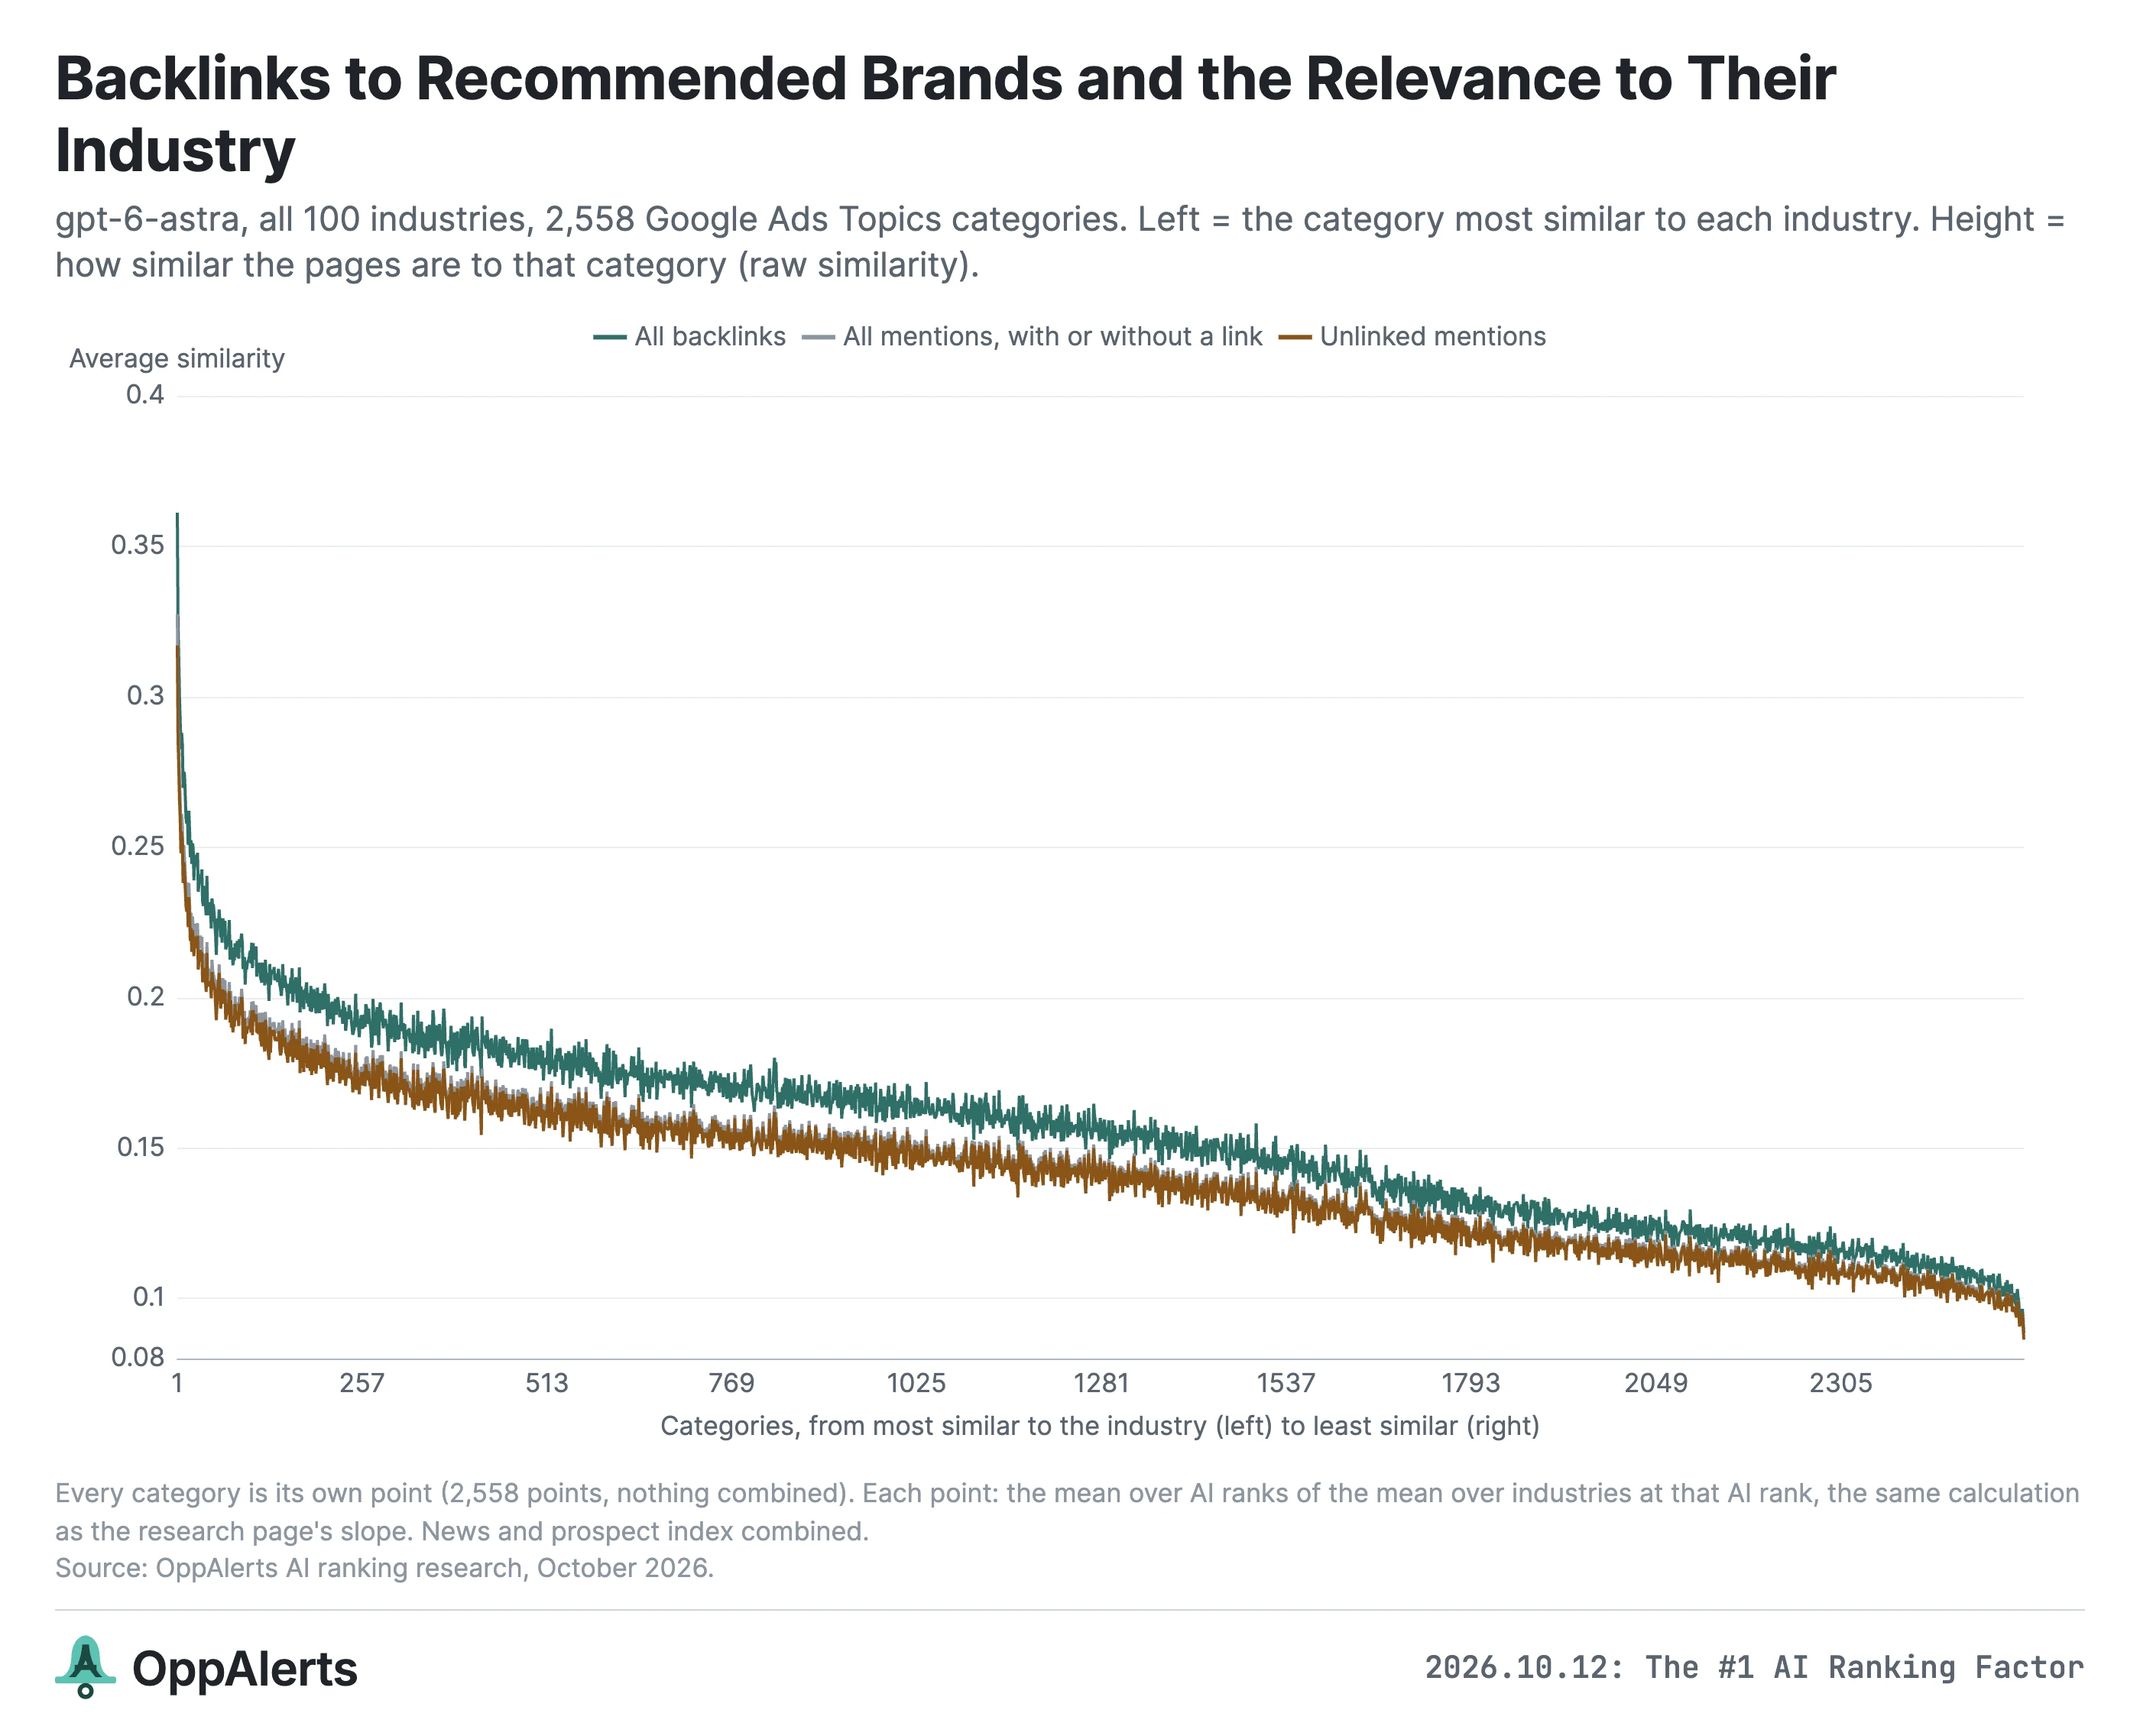
This chart combines all 100 industries for GPT-6 Astra.
Across the bottom are the 2,558 Google Ads Topics categories, ordered from most similar to the industry on the left to least similar on the right. The height shows the average similarity of the pages to each category.
The blue line is backlinks. Green is all brand mentions. Orange is mentions without links.
Each industry's categories are sorted in that industry's own order before I average them together. Every category has its own point in the chart.
You can see the same thing in all three lines. The pages are most similar to the categories closest to the industry's own category, and less similar as we move away from it.
The pages linking to hotel brands are, on balance, about hotels and related subjects. The same is true for the pages mentioning those brands, even when there's no link.
Here's that data in 3D, first for backlinks, then for unlinked mentions:
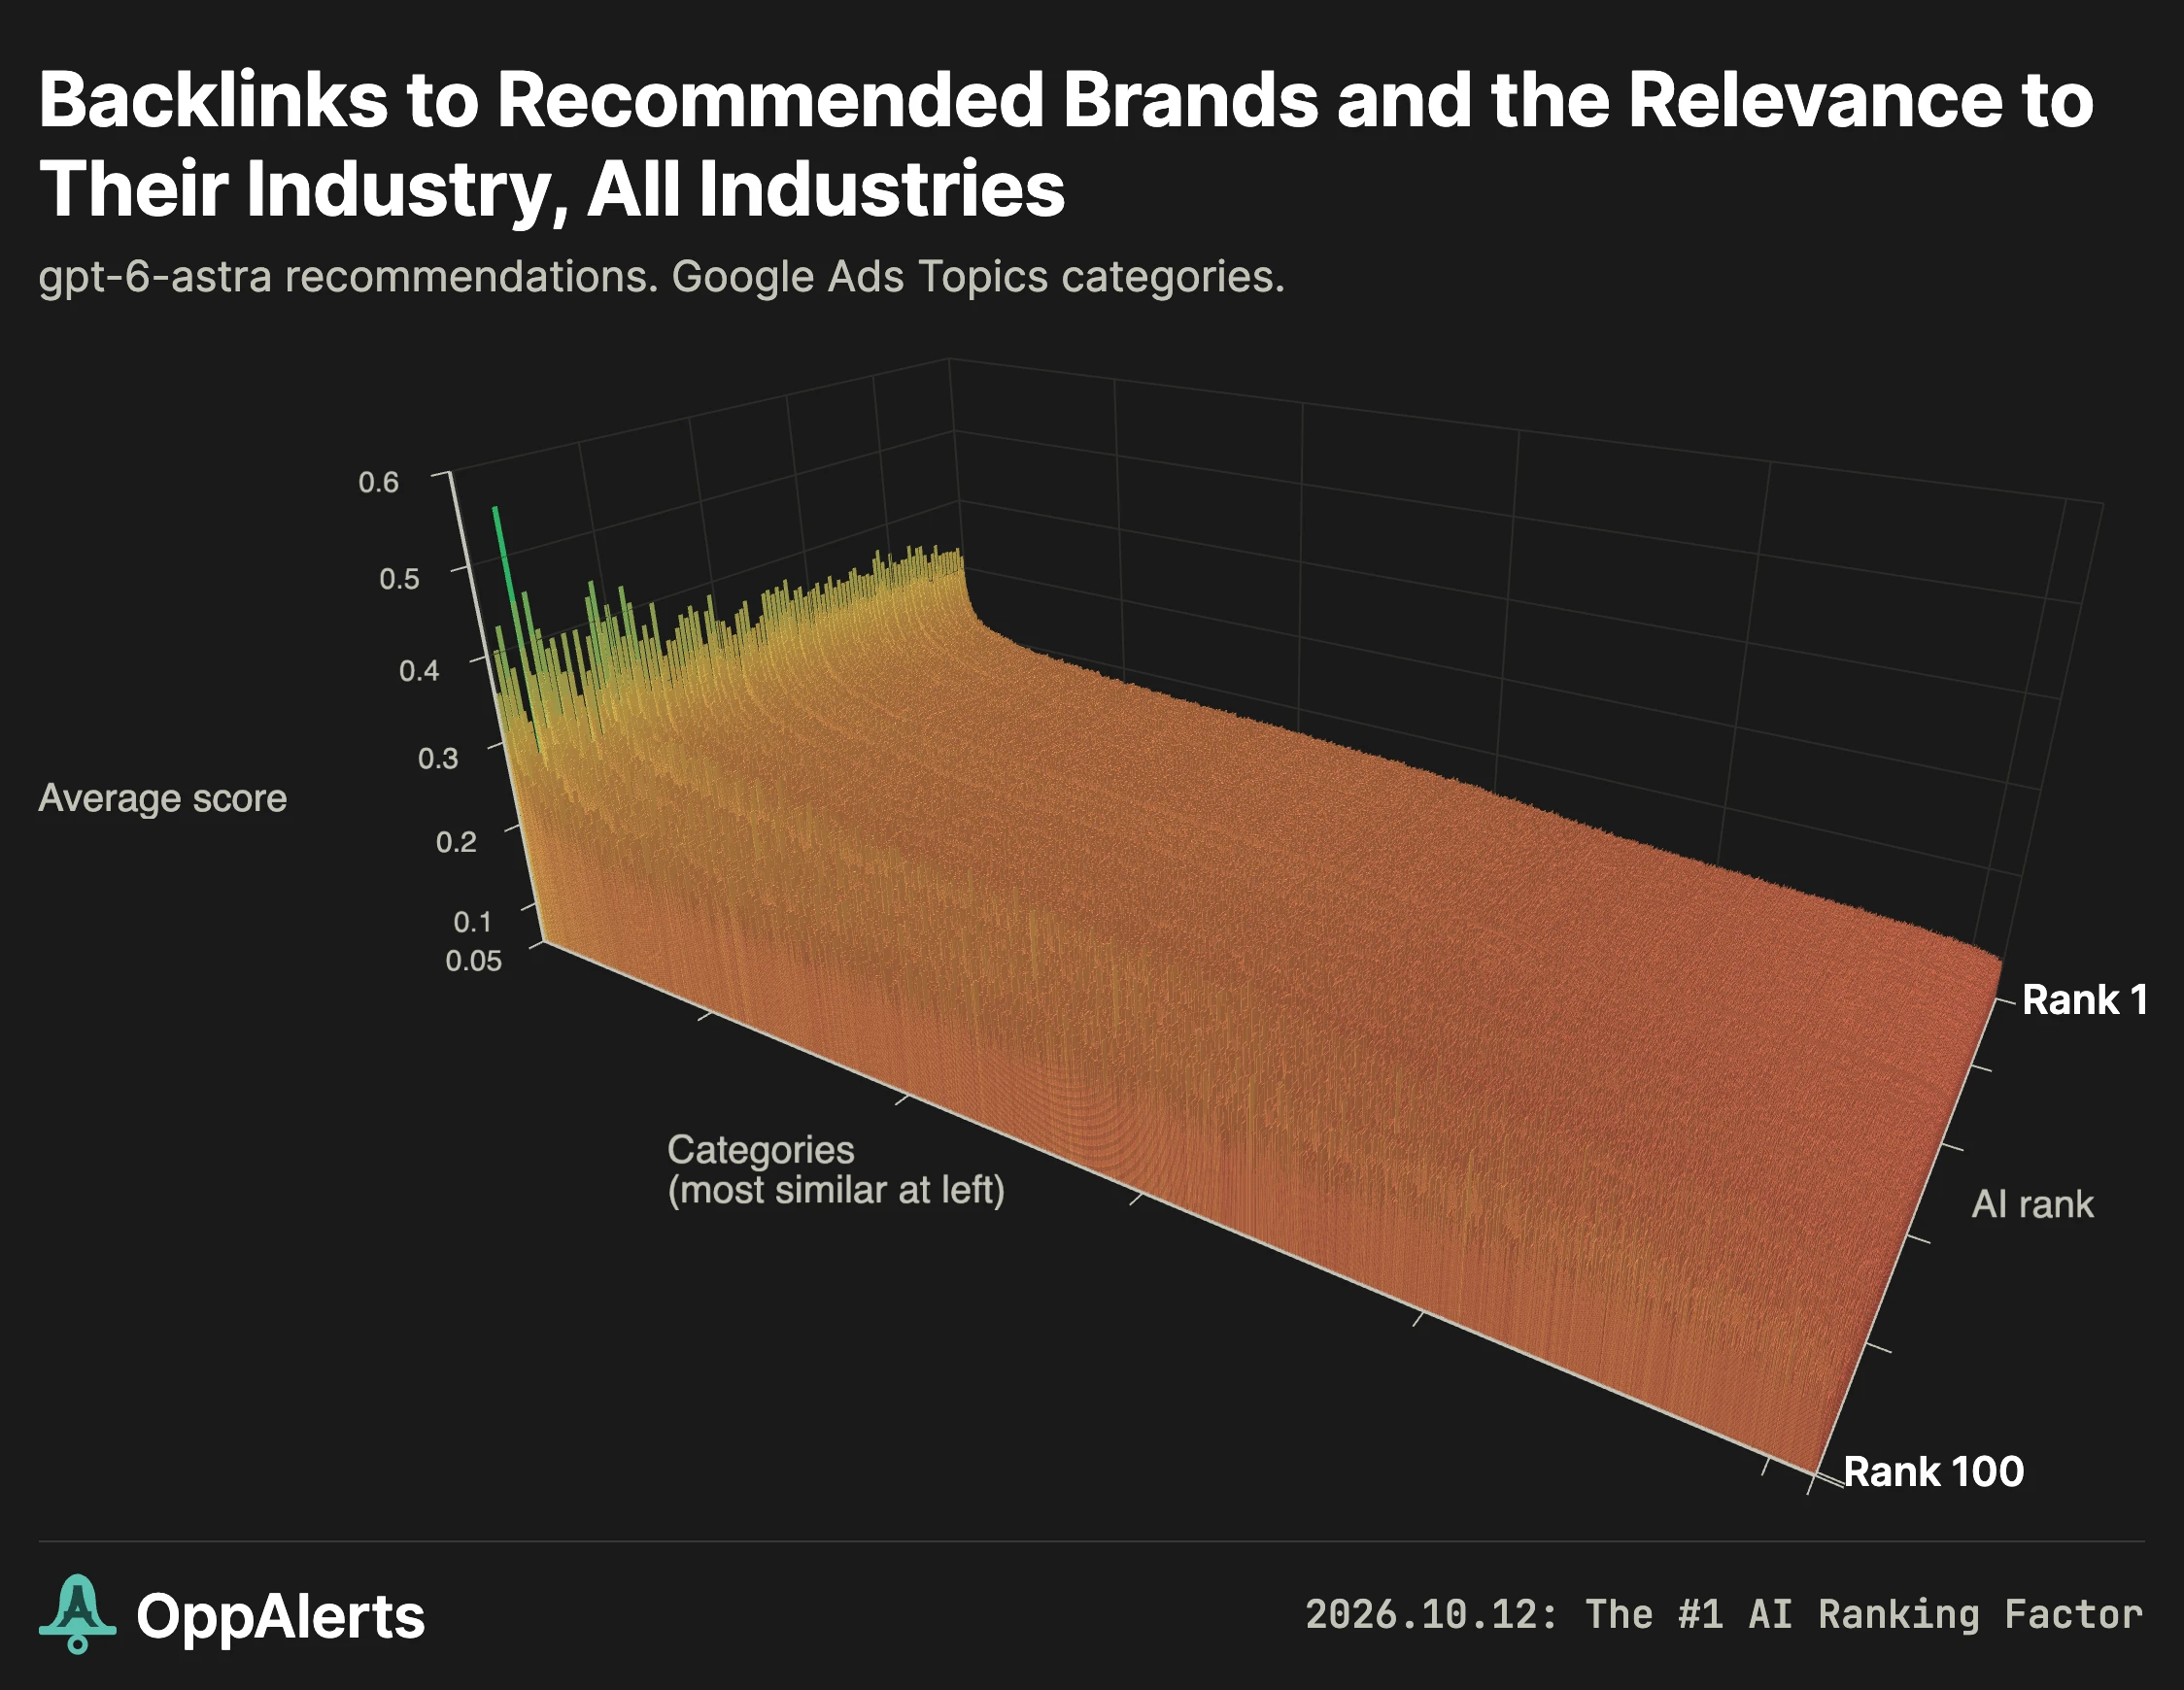
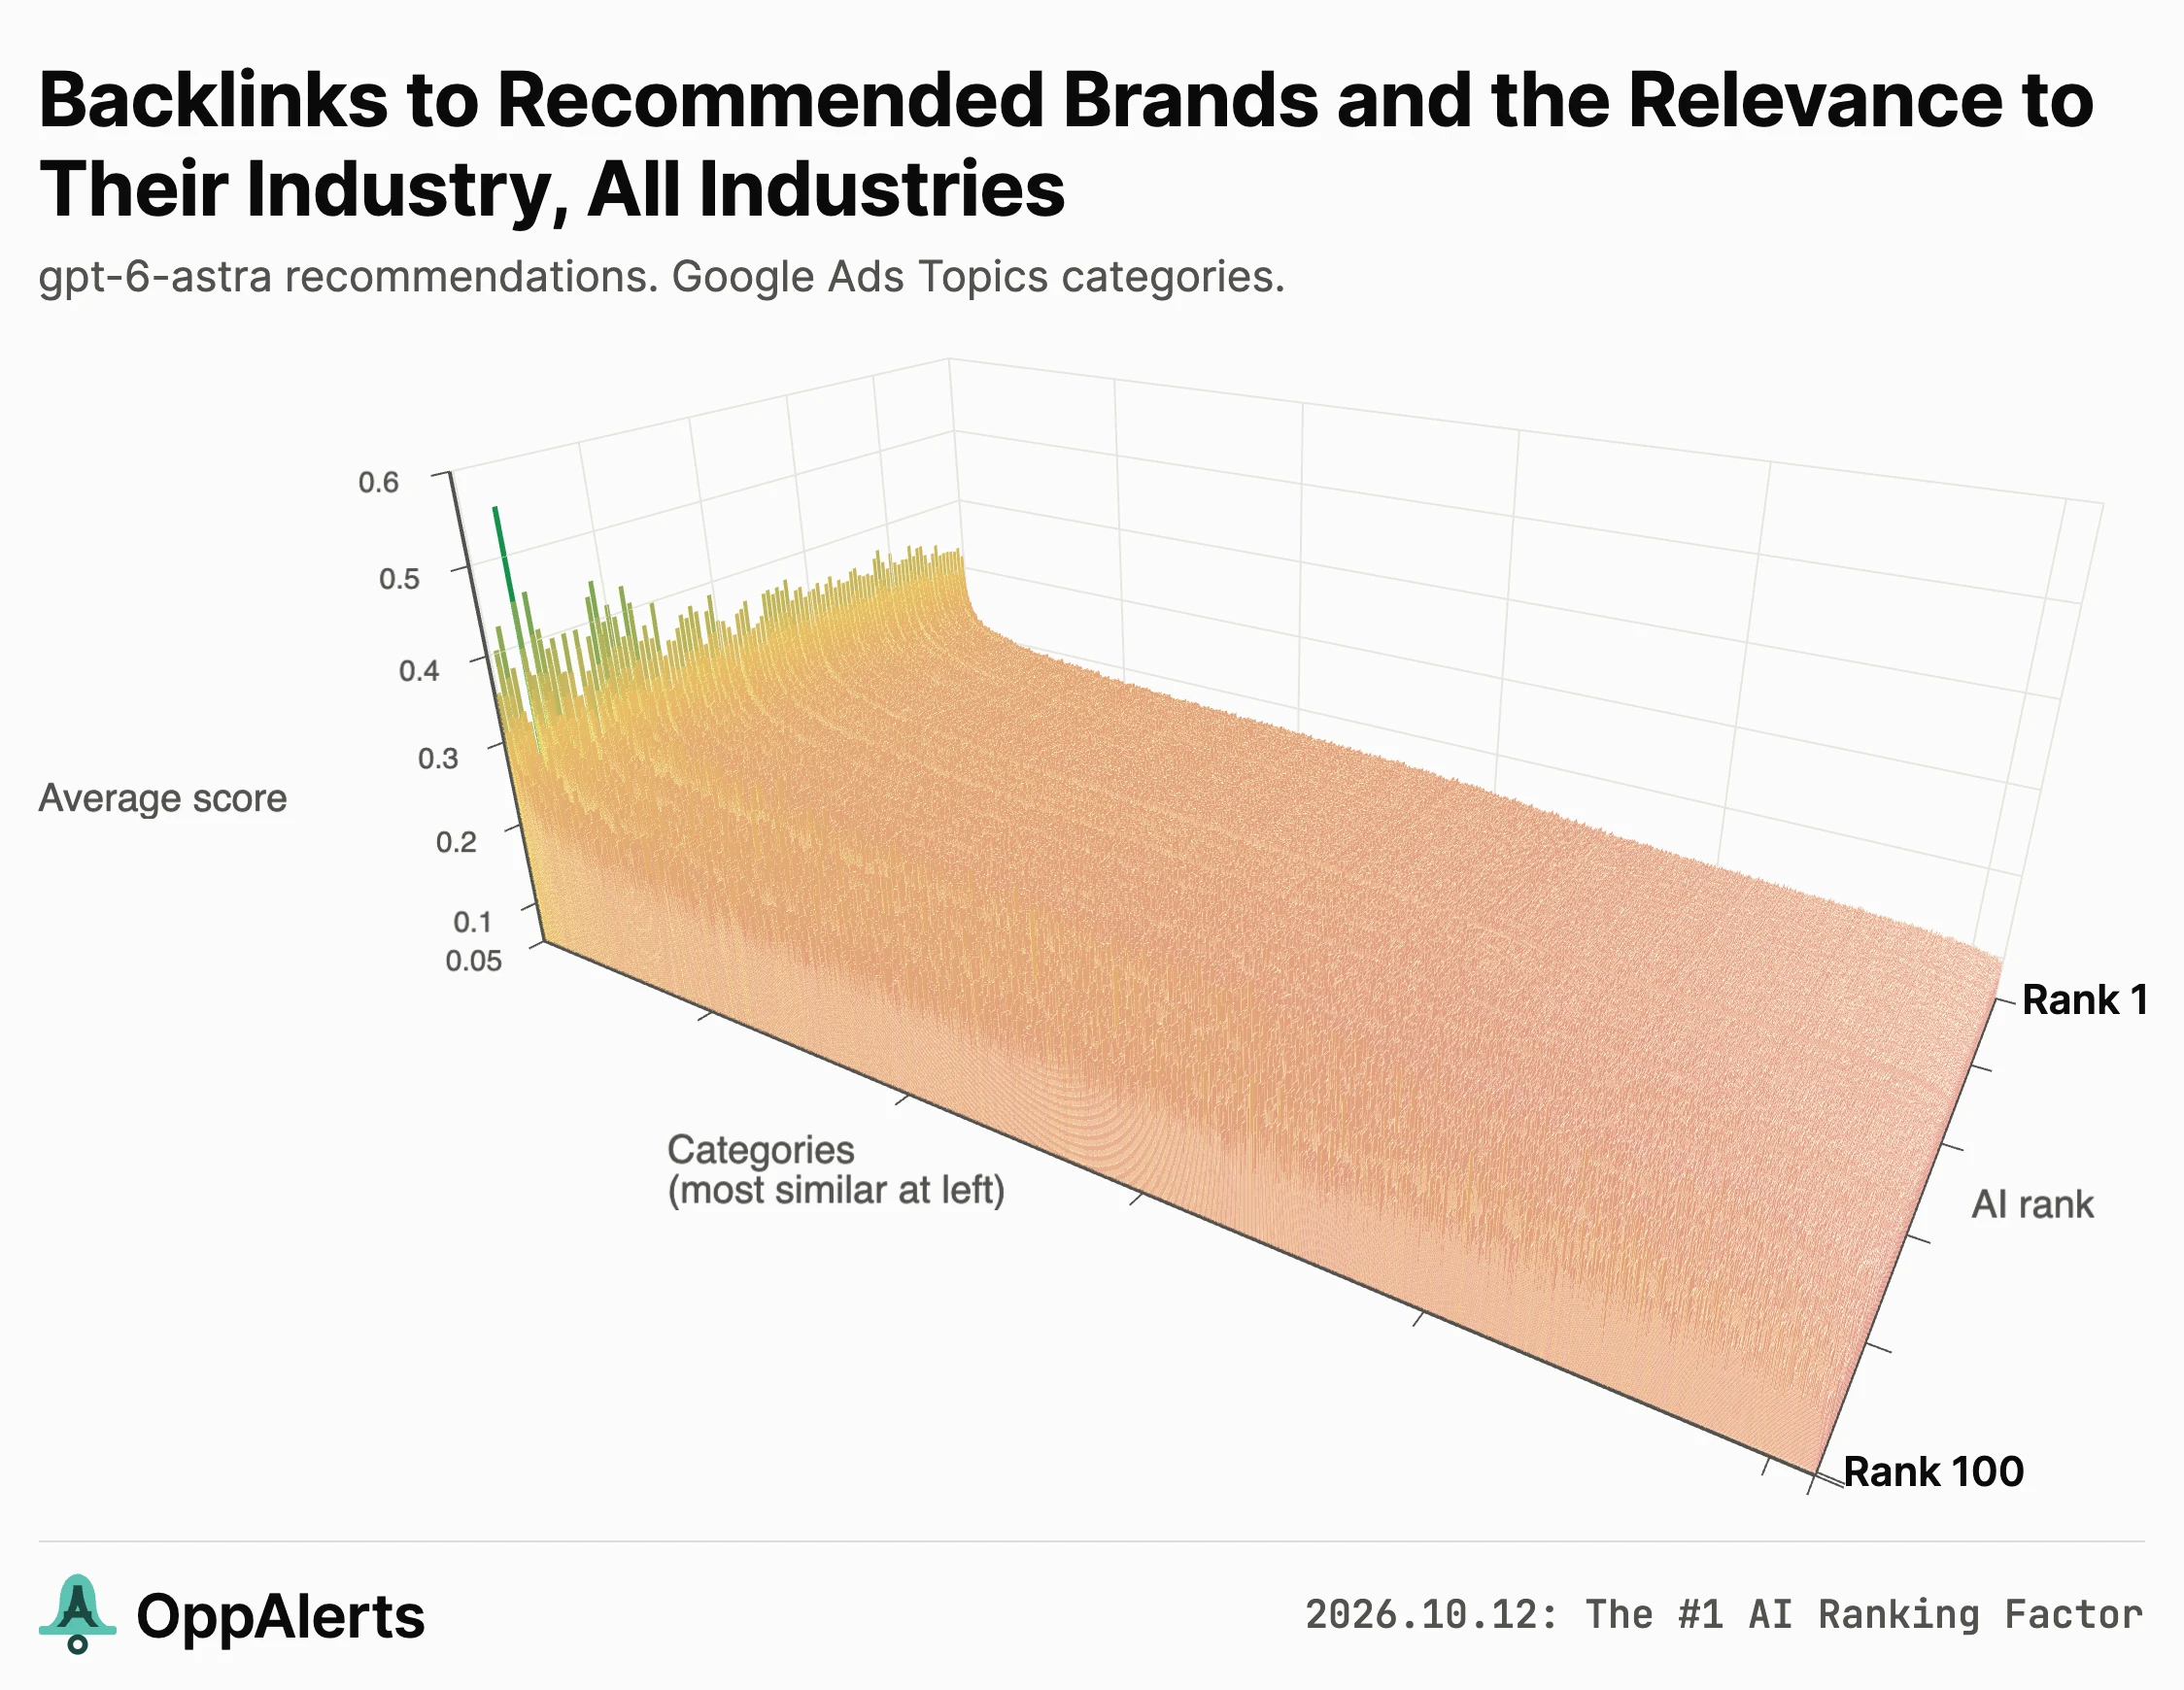
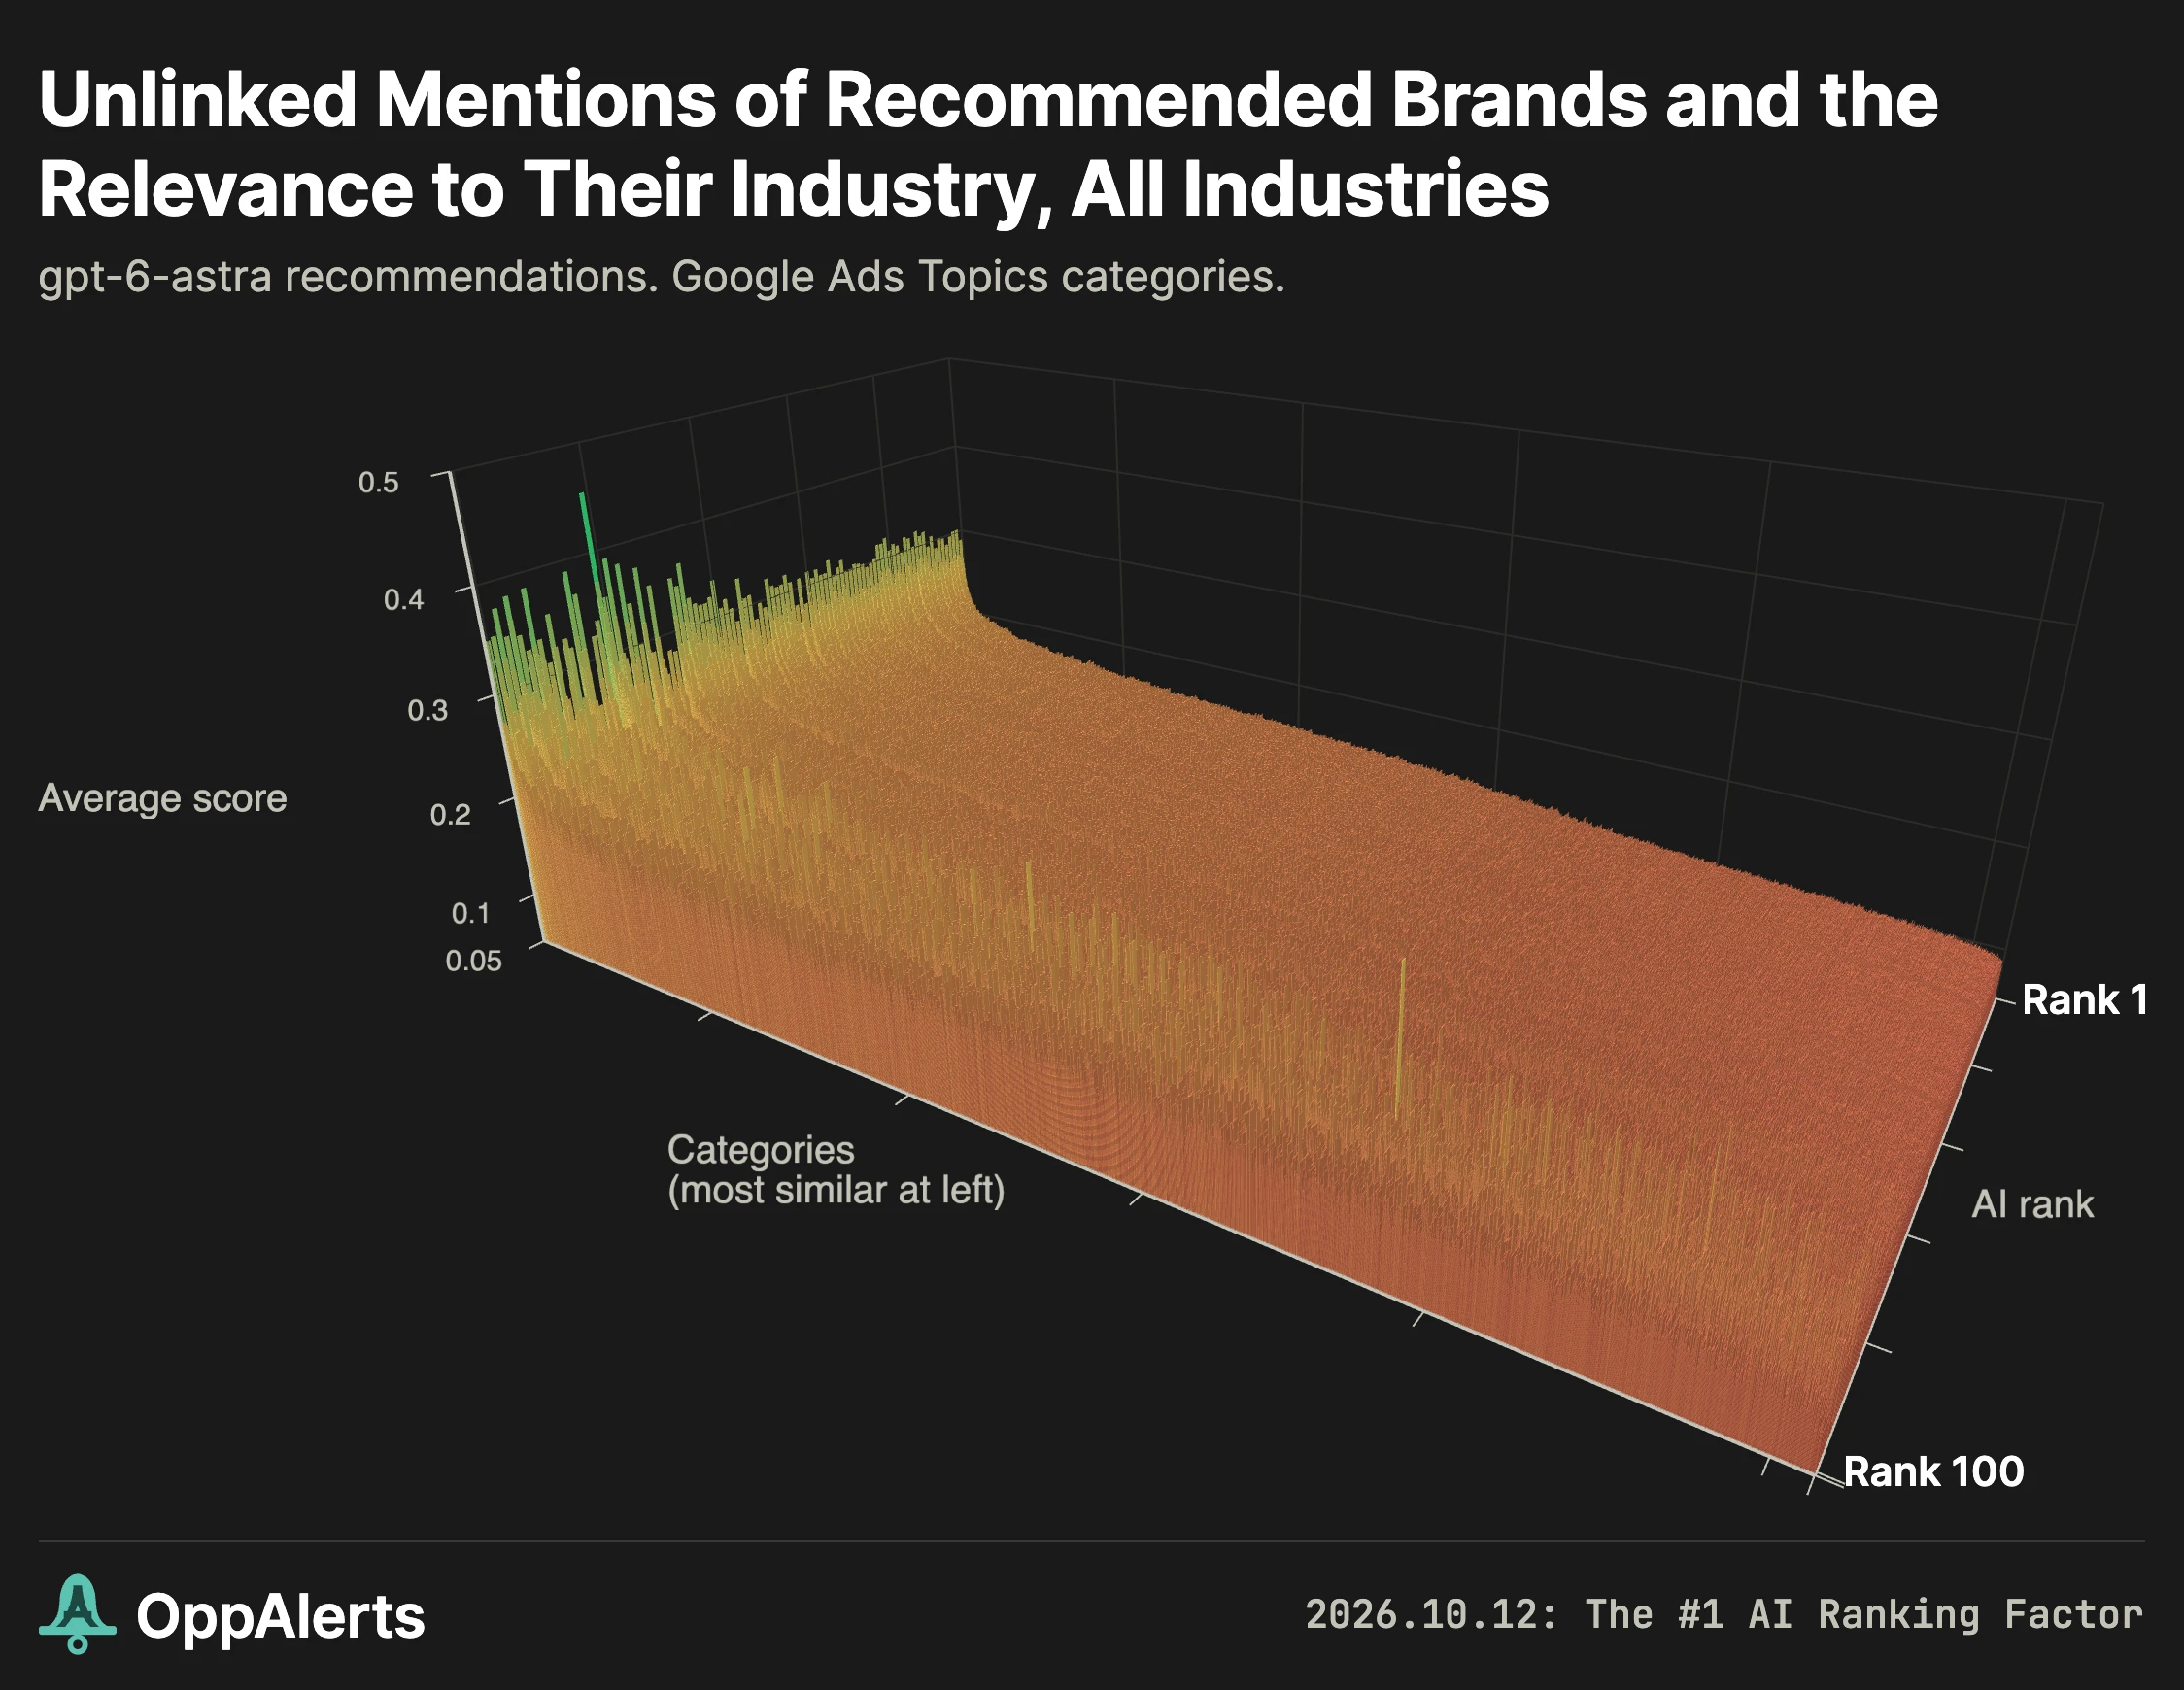
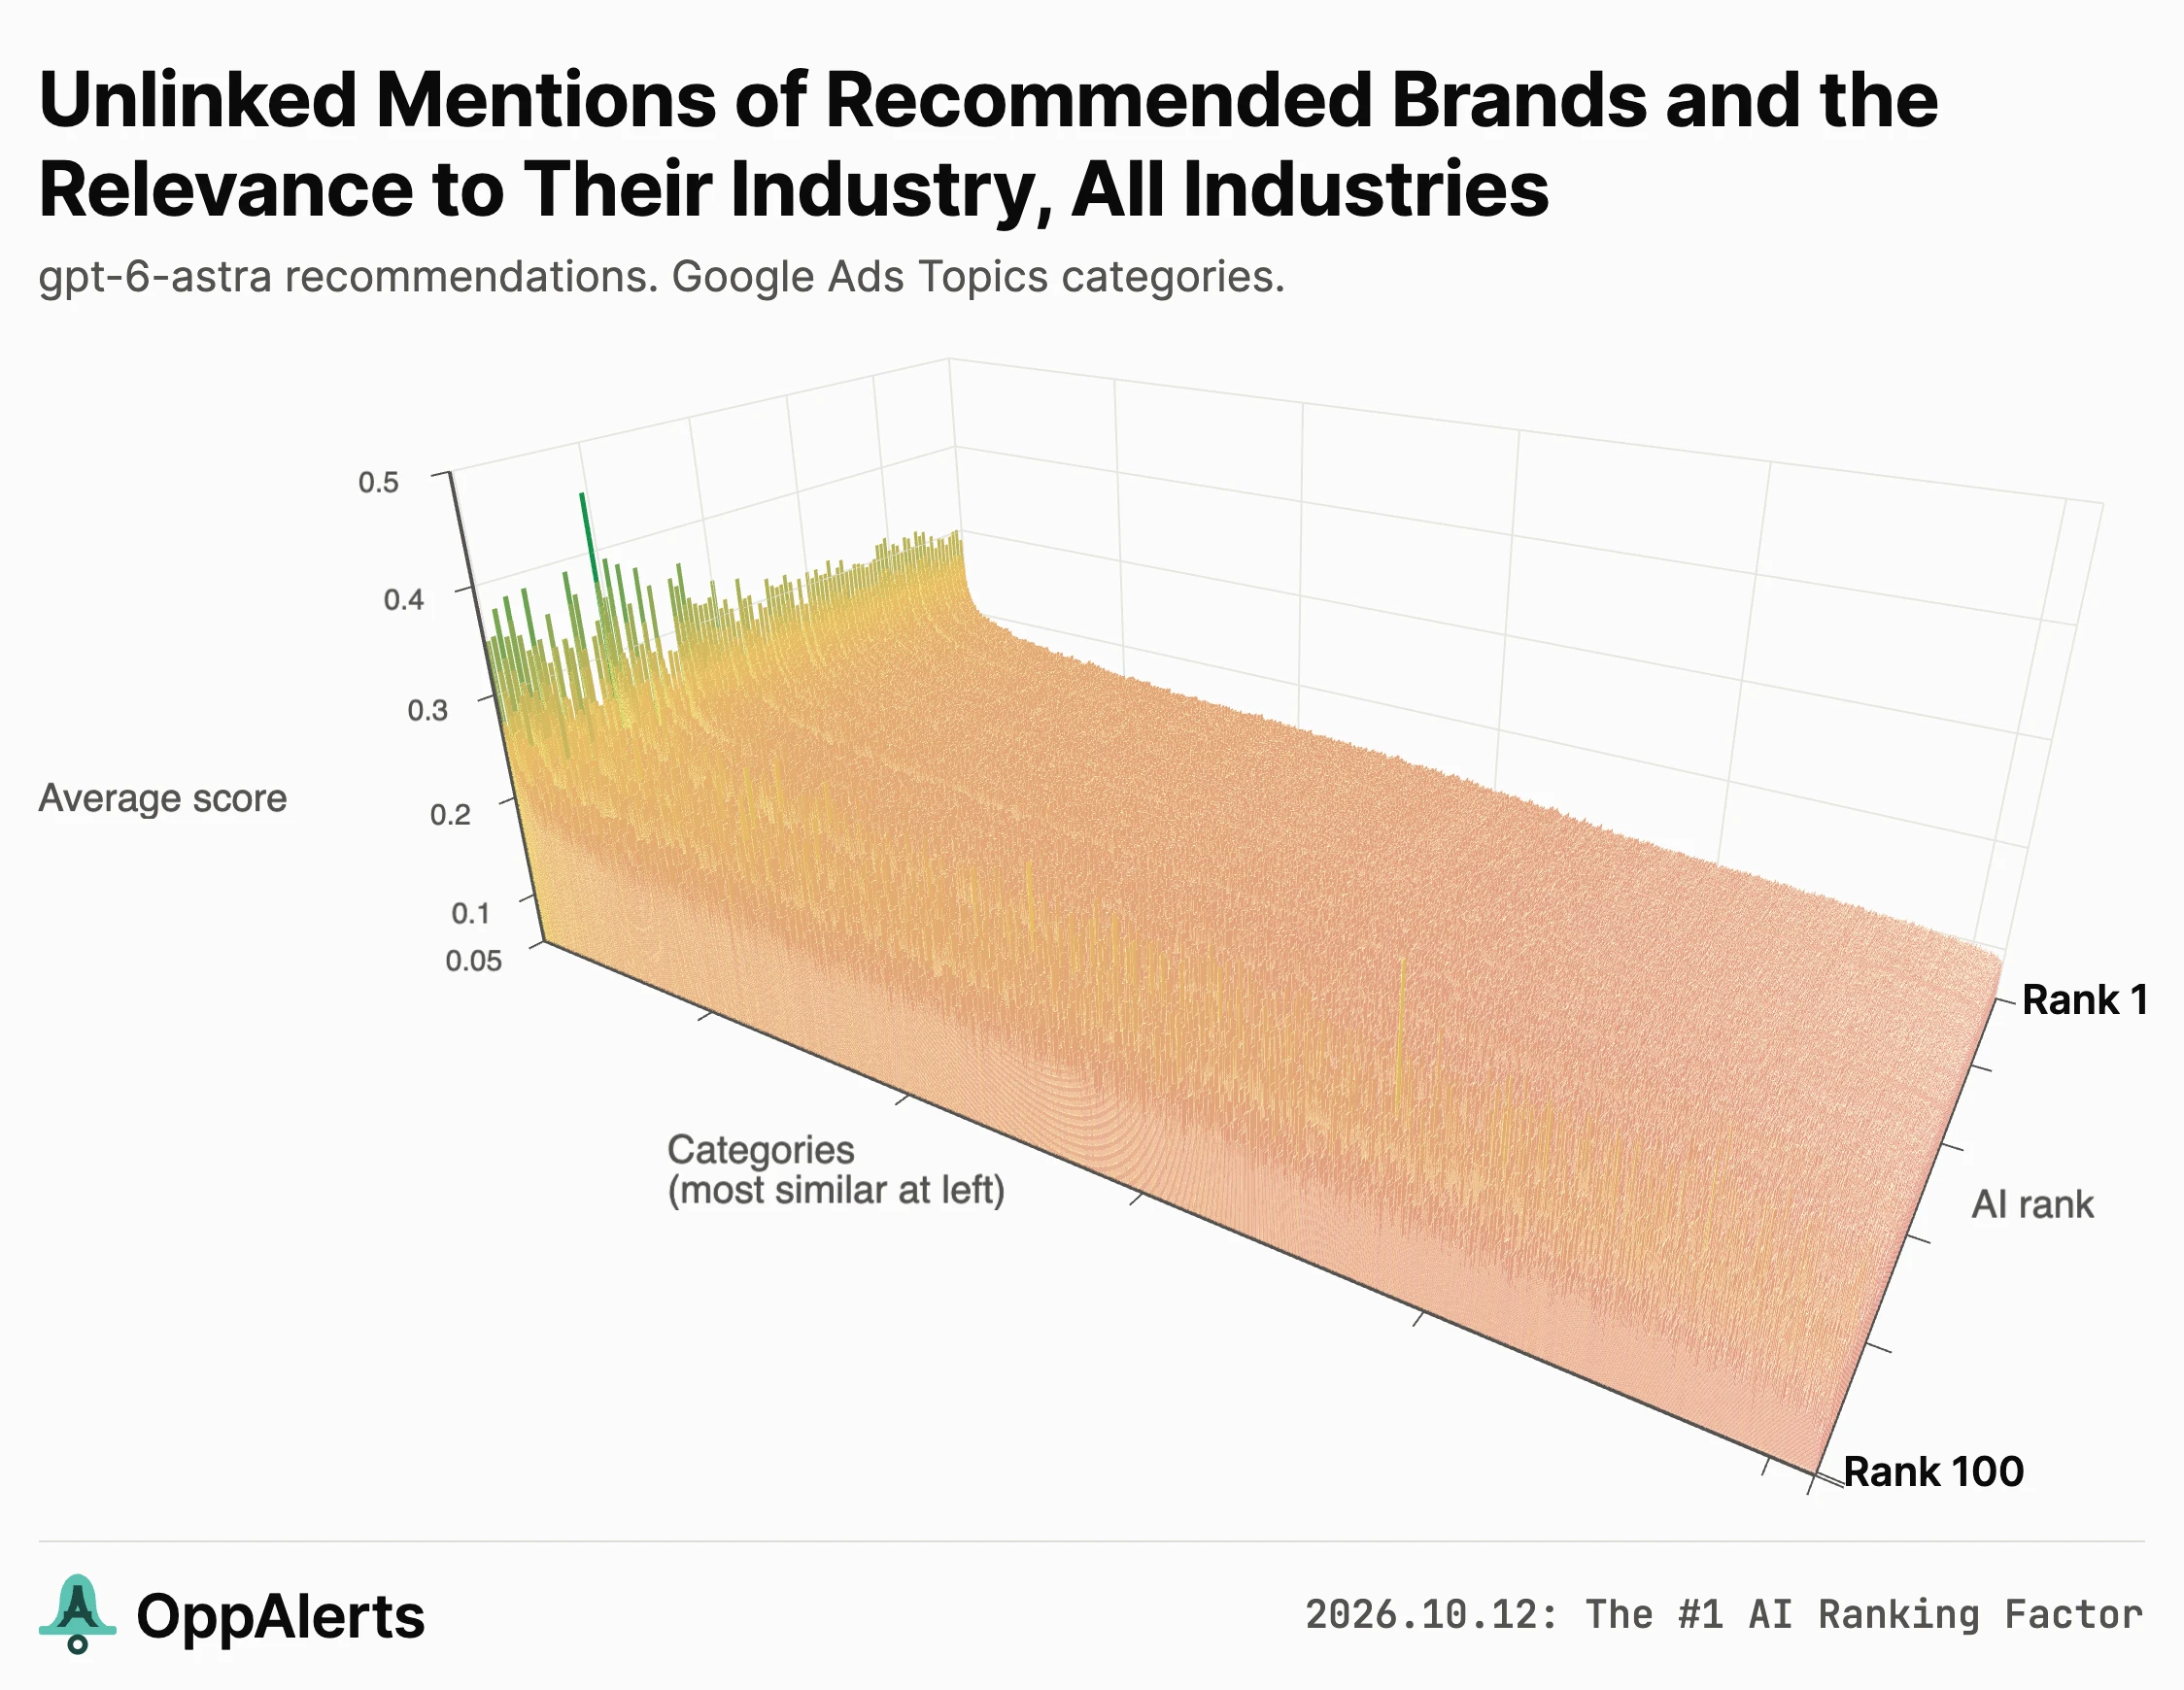
Each row is a brand, with AI rank 1 at the back. Each column is a category, with the industry's own category on the left. The height and color show the similarity score.
The charts show individual industries as well as averages across all 100.
As you move down the rankings toward rank 100, the backlink profiles get less focused. They still generally follow the same trend, but the curve gets choppier. Part of that is simply that lower-ranked brands have fewer backlinks. With only a handful of backlinks, a couple of unrelated pages can move the whole profile. The more backlinks a site has, the more they settle into a tighter pattern. So when you see the front rows of these charts looking noisier, that's what's going on. The section on why some of the charts get spiky goes into this in more detail.
How often the pattern holds
I didn't want to rely on a chart that looked convincing. I counted how often the pattern held.
For the 17 AI channels plus the brands named in Google's AI Overviews, there are:
18 channels × 100 industries × 4 taxonomies × 3 sets of pages = 21,600 curves.
For each curve, I compared the average score of the most similar quarter of categories with the average of the least similar quarter.
All 21,600 passed.
I also ran a narrower test: compare just the industry's own category with the single least similar category. That passed in 21,593 cases.
The seven exceptions all came from one industry in one taxonomy: GPU and AI infrastructure vendors in IAB Ad Product. The industry's selected category is “Circuit Boards and Components,” while the least similar category is “Debated Sensitive Social Issue.” My guess is that pages about AI companies also discuss the public debate around AI. The broader quarter test still passes there.
Google's organic results and AI Overview citations were a little different, with 13 exceptions out of 2,400 curves. Those lists often point to publishers. For hotels, the top organic results include usnews.com, tripadvisor.com, revenuebase.ai, tophotelbrands.com, and cntraveler.com. A publisher's backlinks can cover a much wider set of topics.
So we have a very consistent relevance pattern across the recommended brands.
The next step is to look at what separates the first recommendation from the tenth, or the fiftieth.
A closer look at the hotel recommendations
I'm using hotels throughout because most of us have stayed in one, and the industry includes everything from global chains to individual inns.
Here's GPT-6 Astra's full list of 100 hotel recommendations:
| AI rank | Domain | AI score | Backlinks | Relevant backlinks | Unlinked mentions | PageRank | PRoT |
|---|---|---|---|---|---|---|---|
| 1 | marriott.com | 14.08 | 18,529 | 10,083 | 61,473 | 60 | 3,153 |
| 2 | hilton.com | 7.08 | 13,016 | 6,859 | 76,577 | 57 | 2,973 |
| 3 | mgmresorts.com | 6.04 | 1,687 | 713 | 9,214 | 48 | 2,368 |
| 4 | fourseasons.com | 4.94 | 3,284 | 2,084 | 94 | 43 | 2,315 |
| 5 | wynnlasvegas.com | 4.79 | 347 | 194 | 2,924 | 33 | 1,748 |
| 6 | hyatt.com | 4.76 | 7,580 | 4,596 | 55,662 | 55 | 2,798 |
| 7 | thebreakers.com | 2.91 | 114 | 63 | 260 | 19 | 1,262 |
| 8 | venetianlasvegas.com | 2.78 | 358 | 178 | 2,701 | 33 | 1,215 |
| 9 | ritzcarlton.com | 2.56 | 2,182 | 1,305 | 14,873 | 40 | 2,251 |
| 10 | theplazany.com | 1.77 | 93 | 48 | 10 | 20 | 1,224 |
| 11 | aman.com | 1.69 | 600 | 403 | 327 | 32 | 1,701 |
| 12 | wyndhamhotels.com | 1.64 | 2,389 | 1,150 | 26,456 | 45 | 2,475 |
| 13 | ihg.com | 1.61 | 6,445 | 4,227 | 17,026 | 51 | 2,714 |
| 14 | bestwestern.com | 1.49 | 1,568 | 959 | 11,566 | 43 | 2,333 |
| 15 | holidayinn.com | 1.46 | 235 | 139 | 19,936 | 34 | 1,979 |
| 16 | westin.com | 1.27 | 32 | 23 | not searched | 21 | 1,316 |
| 17 | hoteldel.com | 1.27 | 327 | 90 | 913 | 23 | 1,397 |
| 18 | sheraton.com | 1.23 | 30 | 22 | 22,263 | 23 | 1,401 |
| 19 | rosewoodhotels.com | 1.22 | 1,151 | 817 | 433 | 35 | 1,896 |
| 20 | fairmont.com | 1.18 | 1,943 | 984 | 465 | 40 | 2,205 |
| 21 | stregis.com | 1.17 | 16 | 11 | 12 | 15 | 1,051 |
| 22 | omnihotels.com | 1.15 | 1,949 | 814 | 819 | 41 | 2,184 |
| 23 | waldorfastoria.com | 1.13 | 12 | 12 | 7,028 | 14 | 995 |
| 24 | aubergeresorts.com | 1.05 | 466 | 291 | not searched | 30 | 1,697 |
| 25 | thebroadmoor.com | 1.04 | 1 | 1 | not searched | 1 | 94 |
| 26 | postranchinn.com | 0.98 | 100 | 72 | 190 | 17 | 1,118 |
| 27 | loewshotels.com | 0.92 | 618 | 364 | 596 | 36 | 1,900 |
| 28 | cosmopolitanlasvegas.com | 0.92 | 217 | 119 | not searched | 31 | 1,593 |
| 29 | blackberryfarm.com | 0.89 | 76 | 36 | 11 | 17 | 1,156 |
| 30 | fontainebleau.com | 0.87 | 160 | 56 | 480 | 23 | 1,352 |
| 31 | choicehotels.com | 0.86 | 3,573 | 1,294 | 2,941 | 47 | 2,452 |
| 32 | doubletree.com | 0.83 | 94 | 52 | not searched | 27 | 1,538 |
| 33 | hamptoninn.com | 0.77 | 117 | 75 | 8,521 | 30 | 1,652 |
| 34 | intercontinental.com | 0.70 | 1,036 | 821 | 3,962 | 36 | 2,005 |
| 35 | mandarinoriental.com | 0.68 | 891 | 570 | 6,333 | 36 | 1,955 |
| 36 | thegreenbrier.com | 0.67 | 1 | 0 | not searched | 1 | 74 |
| 37 | sonesta.com | 0.59 | 544 | 329 | 2,577 | 36 | 1,853 |
| 38 | broadmoor.com | 0.54 | 174 | 118 | 2,777 | 23 | 1,344 |
| 39 | twinfarms.com | 0.51 | 54 | 41 | 73 | 11 | 804 |
| 40 | halekulani.com | 0.50 | 62 | 32 | 259 | 20 | 1,171 |
| 41 | ritz-carlton.com | 0.48 | 1 | 0 | not searched | 1 | 238 |
| 42 | montage.com | 0.47 | 139 | 84 | 146 | 33 | 969 |
| 43 | oceanhouseri.com | 0.46 | 52 | 29 | 29 | 15 | 931 |
| 44 | grandhotel.com | 0.45 | 109 | 53 | 320 | 19 | 1,095 |
| 45 | druryhotels.com | 0.44 | 274 | 150 | 161 | 30 | 1,639 |
| 46 | hampton.com | 0.43 | 21 | 19 | 8,588 | 23 | 1,020 |
| 47 | thelittlenell.com | 0.42 | 167 | 124 | 477 | 20 | 1,166 |
| 48 | mohonk.com | 0.39 | 127 | 75 | 514 | 18 | 1,185 |
| 49 | embassysuites.com | 0.39 | 51 | 37 | 5,853 | 22 | 1,305 |
| 50 | grandwailea.com | 0.38 | 96 | 48 | 531 | 19 | 1,139 |
| 51 | kimptonhotels.com | 0.36 | 523 | 488 | 5,935 | 26 | 1,562 |
| 52 | seaisland.com | 0.34 | 149 | 62 | 5 | 20 | 1,152 |
| 53 | peninsula.com | 0.34 | 558 | 295 | 484 | 32 | 1,748 |
| 54 | montagehotels.com | 0.32 | 177 | 122 | not searched | 22 | 1,435 |
| 55 | thepointresort.com | 0.31 | 17 | 15 | 92 | 7 | 554 |
| 56 | kiawahresort.com | 0.31 | 132 | 45 | 240 | 21 | 1,199 |
| 57 | conradhotels.com | 0.29 | 8 | 7 | 392 | 12 | 878 |
| 58 | courtyard.com | 0.27 | 3 | 1 | not searched | 10 | 759 |
| 59 | caesarspalace.com | 0.25 | 15 | 9 | not searched | 22 | 1,202 |
| 60 | nemacolin.com | 0.24 | 80 | 39 | 490 | 19 | 1,103 |
| 61 | littlepalmisland.com | 0.24 | 67 | 60 | 126 | 16 | 959 |
| 62 | thebeverlyhillshotel.com | 0.21 | 2 | 1 | not searched | 1 | 308 |
| 63 | extendedstayamerica.com | 0.19 | 171 | 134 | 683 | 26 | 1,596 |
| 64 | sanctuaryoncamelback.com | 0.18 | 47 | 16 | not searched | 13 | 925 |
| 65 | residenceinn.com | 0.15 | 12 | 10 | not searched | 10 | 740 |
| 66 | pendry.com | 0.15 | 376 | 117 | 69 | 26 | 1,018 |
| 67 | belmond.com | 0.15 | 597 | 382 | 2,411 | 35 | 1,948 |
| 68 | caesars.com | 0.14 | 2,647 | 813 | 5,807 | 45 | 2,352 |
| 69 | castlehillinn.com | 0.14 | 41 | 11 | 75 | 13 | 838 |
| 70 | radissonhotels.com | 0.13 | 1,561 | 655 | 14,726 | 44 | 2,073 |
| 71 | motel6.com | 0.13 | 246 | 154 | 54 | 27 | 1,616 |
| 72 | redroof.com | 0.12 | 254 | 155 | 1,988 | 28 | 1,627 |
| 73 | sanysidroranch.com | 0.12 | 51 | 28 | 321 | 12 | 794 |
| 74 | triplecreekranch.com | 0.11 | 28 | 24 | 39 | 9 | 725 |
| 75 | beverlyhillshotel.com | 0.11 | 4 | 3 | 1,476 | 4 | 569 |
| 76 | langhamhotels.com | 0.11 | 291 | 190 | 159 | 29 | 1,642 |
| 77 | biltmorehotel.com | 0.11 | 74 | 23 | 4 | 26 | 1,133 |
| 78 | editionhotels.com | 0.11 | 352 | 256 | 171 | 26 | 1,562 |
| 79 | brushcreekranch.com | 0.10 | 35 | 25 | 62 | 13 | 831 |
| 80 | thehotelemma.com | 0.10 | 58 | 26 | 211 | 16 | 882 |
| 81 | whotels.com | 0.10 | 33 | 24 | 12 | 13 | 1,066 |
| 82 | hotel-emma.com | 0.09 | 0 | 0 | not searched | 0 | 0 |
| 83 | enchantmentresort.com | 0.09 | 37 | 24 | 97 | 16 | 1,003 |
| 84 | encorebostonharbor.com | 0.09 | 47 | 19 | 953 | 18 | 1,031 |
| 85 | pebblebeach.com | 0.09 | 190 | 34 | 194 | 25 | 1,410 |
| 86 | blackberrymountain.com | 0.09 | 21 | 13 | 35 | 9 | 503 |
| 87 | miravalresorts.com | 0.09 | 103 | 82 | 1,275 | 25 | 1,390 |
| 88 | wentworthmansion.com | 0.08 | 19 | 9 | 39 | 7 | 598 |
| 89 | hotelmonteleone.com | 0.08 | 118 | 28 | 256 | 19 | 1,149 |
| 90 | oceanhouse-ri.com | 0.08 | 0 | 0 | not searched | none | none |
| 91 | waldorfastoriabeverlyhills.com | 0.08 | 46 | 30 | 172 | 14 | 879 |
| 92 | dorchestercollection.com | 0.07 | 446 | 250 | 460 | 30 | 1,703 |
| 93 | peabodymemphis.com | 0.07 | 73 | 20 | 97 | 17 | 1,090 |
| 94 | pelicanhill.com | 0.07 | 57 | 19 | 352 | 19 | 1,157 |
| 95 | ranchatrockcreek.com | 0.06 | 0 | 0 | not searched | 0 | 0 |
| 96 | ranchovalencia.com | 0.06 | 286 | 33 | 132 | 15 | 924 |
| 97 | theranchatrockcreek.com | 0.06 | 39 | 30 | 58 | 19 | 917 |
| 98 | auberge.com | 0.06 | 313 | 163 | 1,233 | 25 | 252 |
| 99 | theamericanclub.com | 0.06 | 0 | 0 | 1 | 0 | 23 |
| 100 | ventanabigsur.com | 0.06 | 58 | 31 | 215 | 17 | 965 |
The AI score is the sum of 1/position over the 25 answers. Marriott appeared in 15 of those answers. A relevant backlink has a z-score of at least 2 for Hotels & Accommodations. For the largest brands, unlinked mention scoring was capped at 50,000 pages per index.
Marriott's score is nearly twice Hilton's, and they have by far the most backlinks and relevant backlinks.
But the rest of the table shows why you shouldn't treat link counts as a formula that determines every position.
Hyatt has the third most relevant backlinks in this table and ranks sixth. MGM, Wynn, and the Venetian rank higher than their link counts alone would suggest. The Breakers and The Plaza are in the top 10 with only 114 and 93 backlinks in these indexes.
The correlation for hotels is 0.50. The relationship is there, but sorting by backlink count alone won't give you the same rankings.
That's the level at which you need to understand your competitors.
The brands at the top have a lot more backlinks from contextually relevant pages
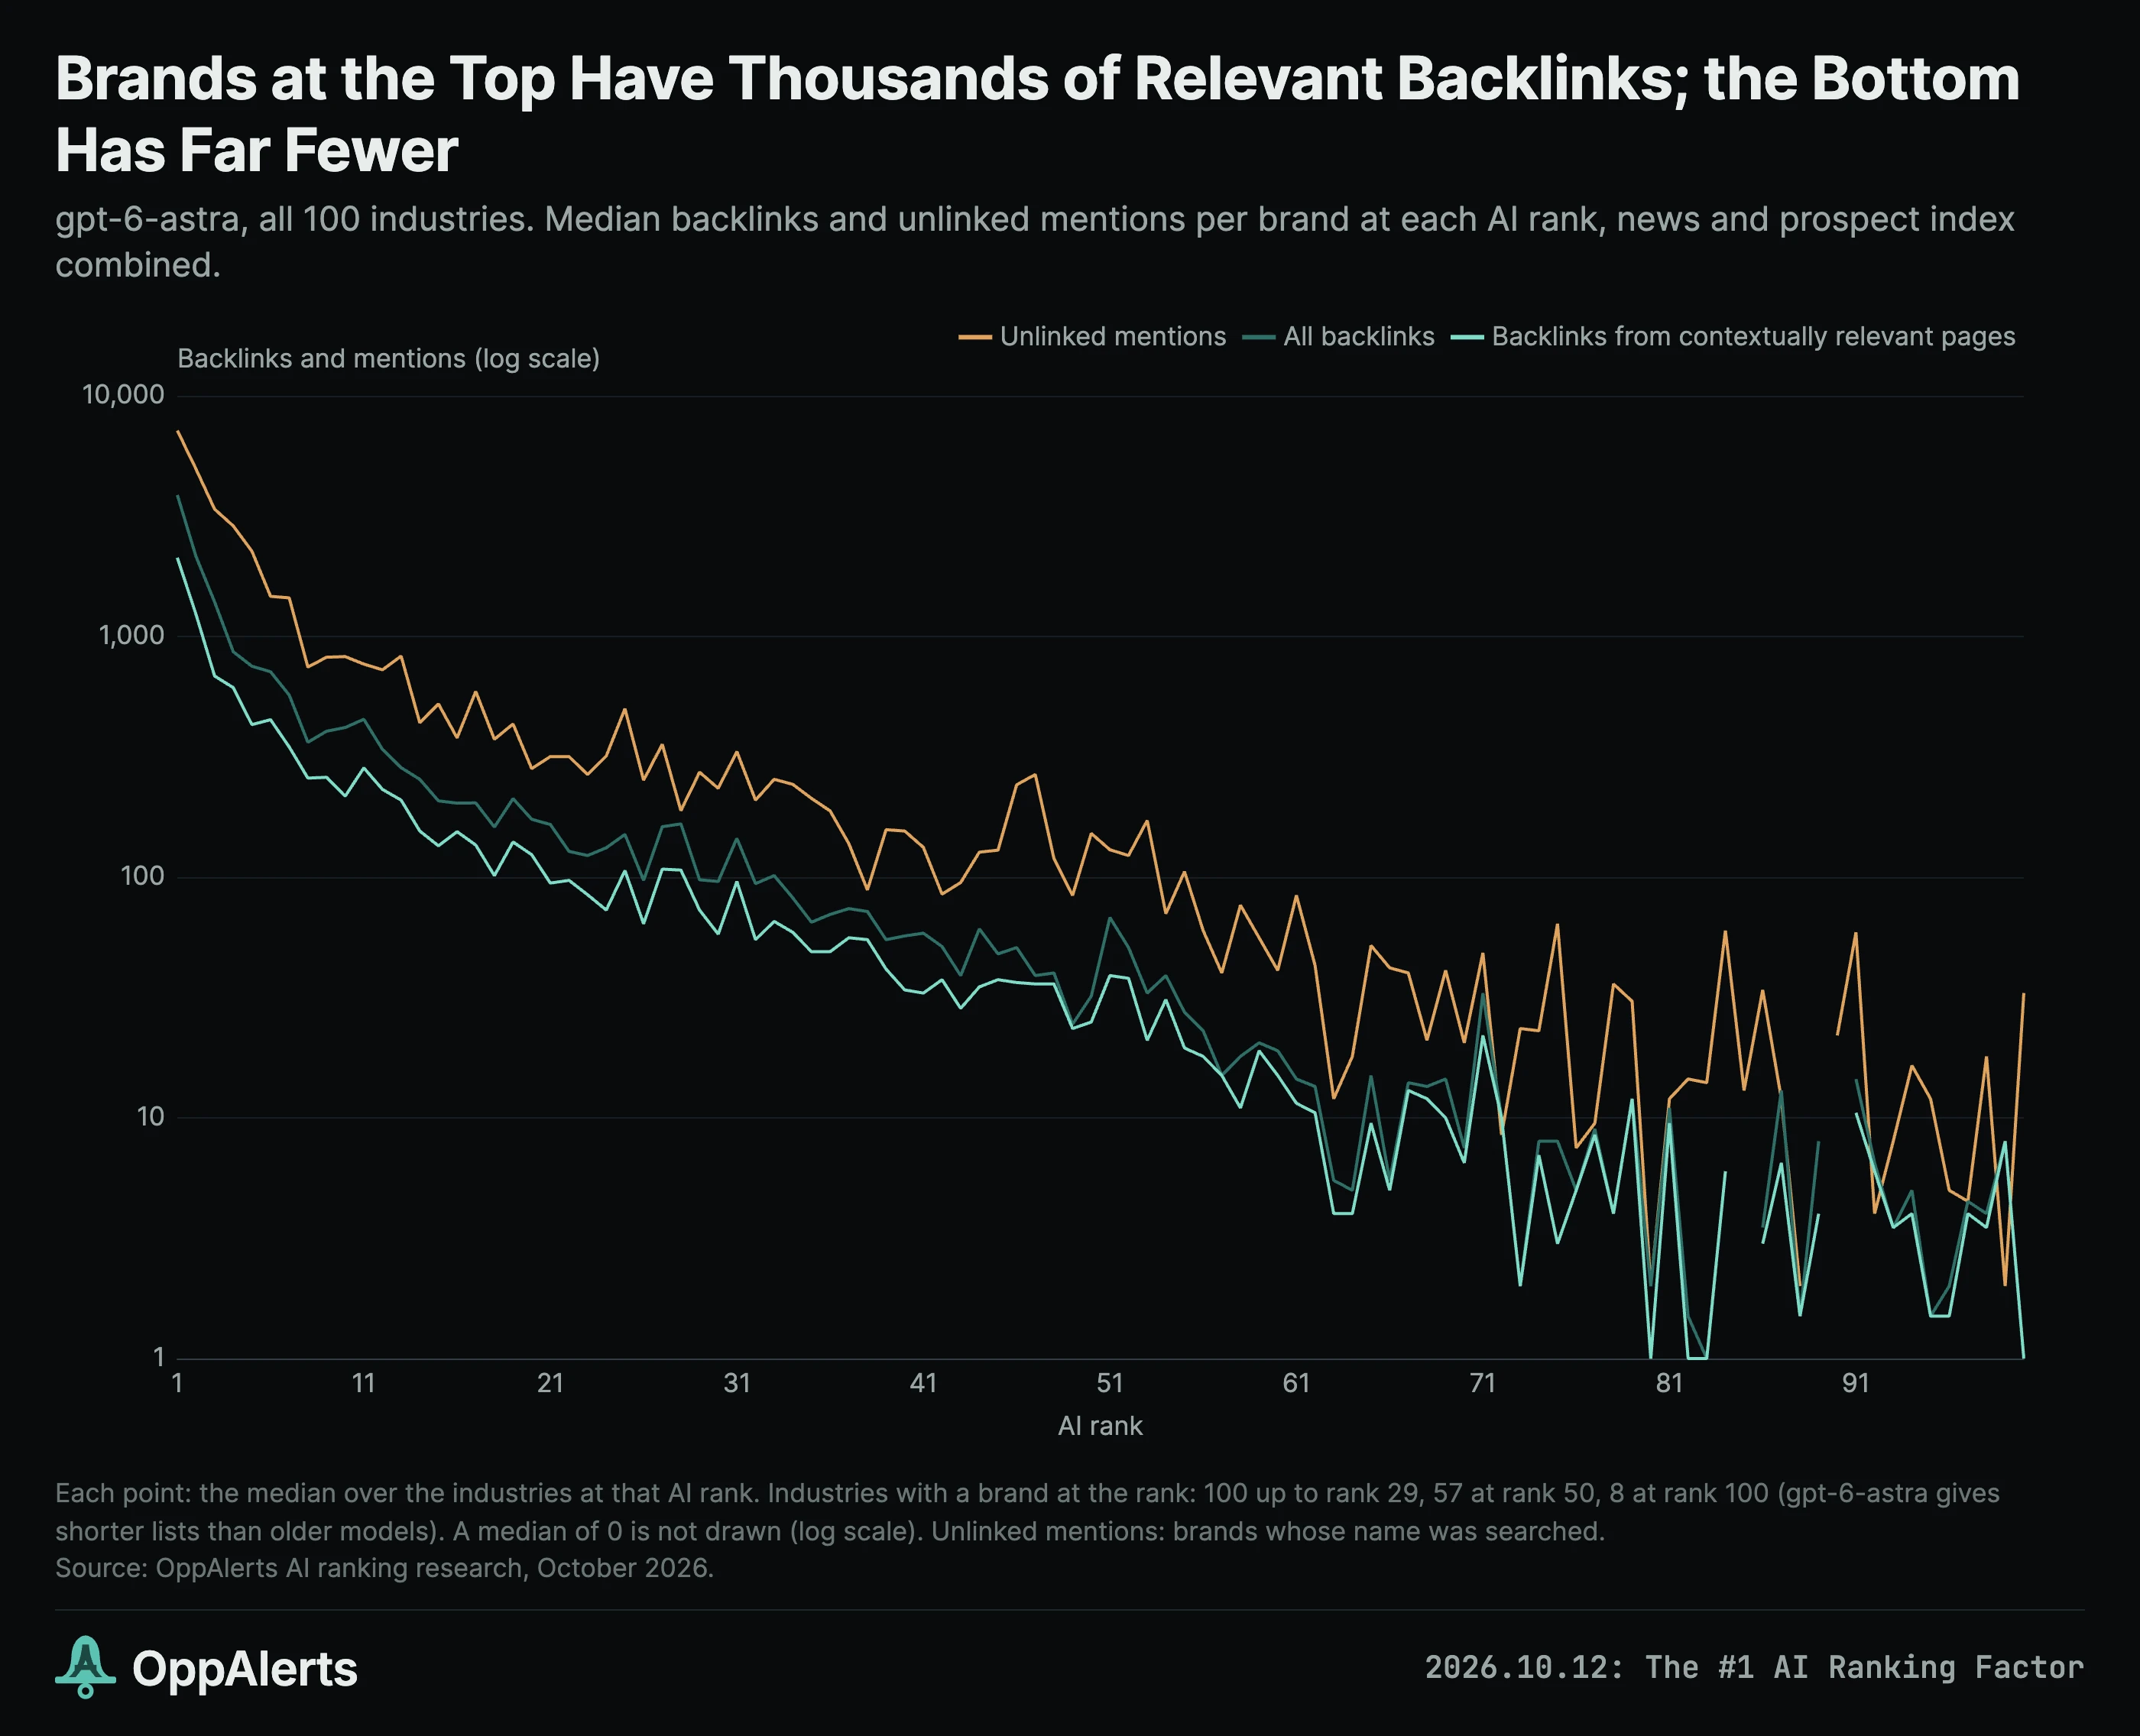
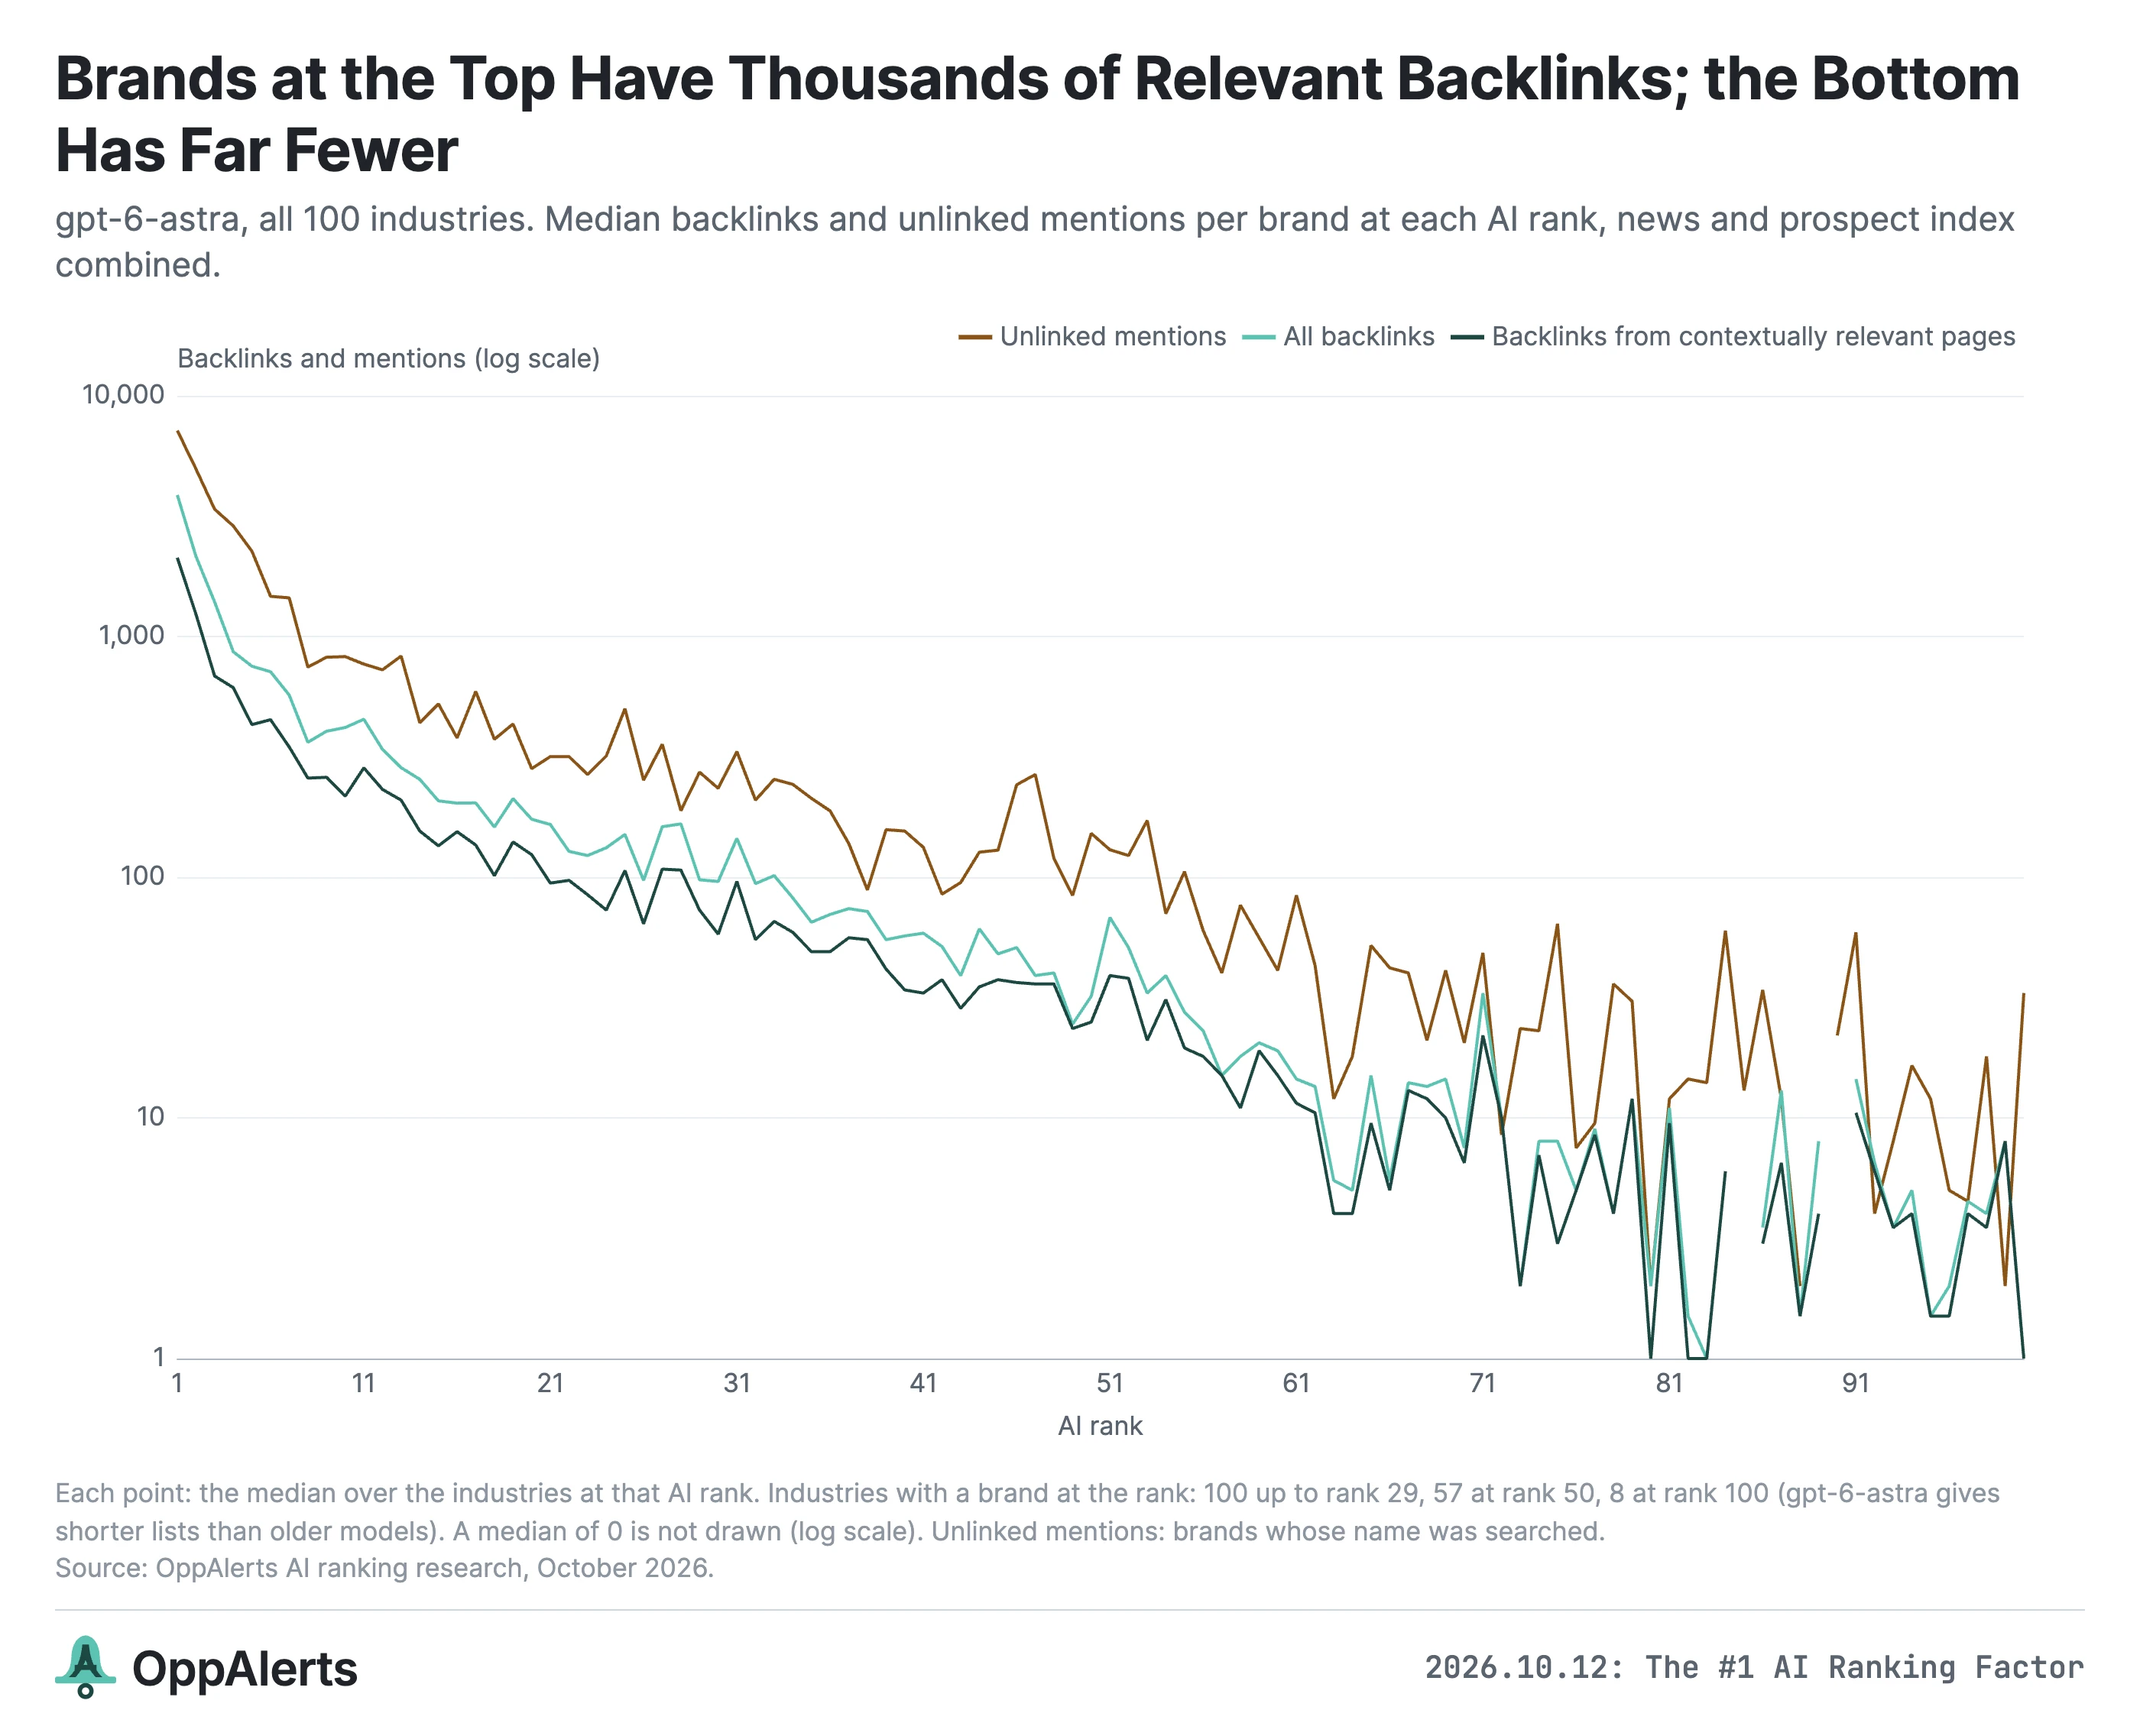
For GPT-6 Astra, the median brand at AI rank 1 has 3,872 backlinks. At rank 50, it's 32.
When I count only the pages strongly related to the industry, that goes from 2,124 at rank 1 to 25 at rank 50.
Here's the full comparison:
| AI rank | Backlinks | Relevant backlinks | Unlinked mentions | Own PageRank | PRoT |
|---|---|---|---|---|---|
| 1 | 3,872 | 2,124 | 7,176 | 45 | 2,381 |
| 2 | 2,151 | 1,237 | 4,965 | 42.5 | 2,278 |
| 3 | 1,392 | 685 | 3,380 | 39.5 | 2,061 |
| 10 | 419 | 217 | 825 | 31 | 1,597 |
| 25 | 151 | 107 | 501 | 26 | 1,243 |
| 50 | 32 | 25 | 152 | 14.5 | 828 |
| 100 | 1 | 1 | 33 | 1 | 131 |
These are medians across the industries represented at each rank. At rank 50, that's 57 industries. At rank 100, it's only eight. Page counts are rounded, and the half points in PageRank come from taking the median of an even number of brands.
For this test, a page counts as relevant when its similarity to the industry's category is at least two standard deviations above its average similarity across categories. In the charts and tables, that's a z-score of 2 or more.10
In other words, the industry's category needs to stand out as something the page is strongly about.
The pattern in those medians is very strong. The correlation between AI rank and median link count is -0.96. Relevant links, unlinked mentions, PageRank, and PRoT are all between -0.95 and -0.97. The negative sign means the counts and scores get smaller as the rank number gets larger.
But averaging across industries smooths out a lot of the variation. Your business competes with individual brands, so we also need to look at the brands within each industry.
Comparing a brand with its competitors
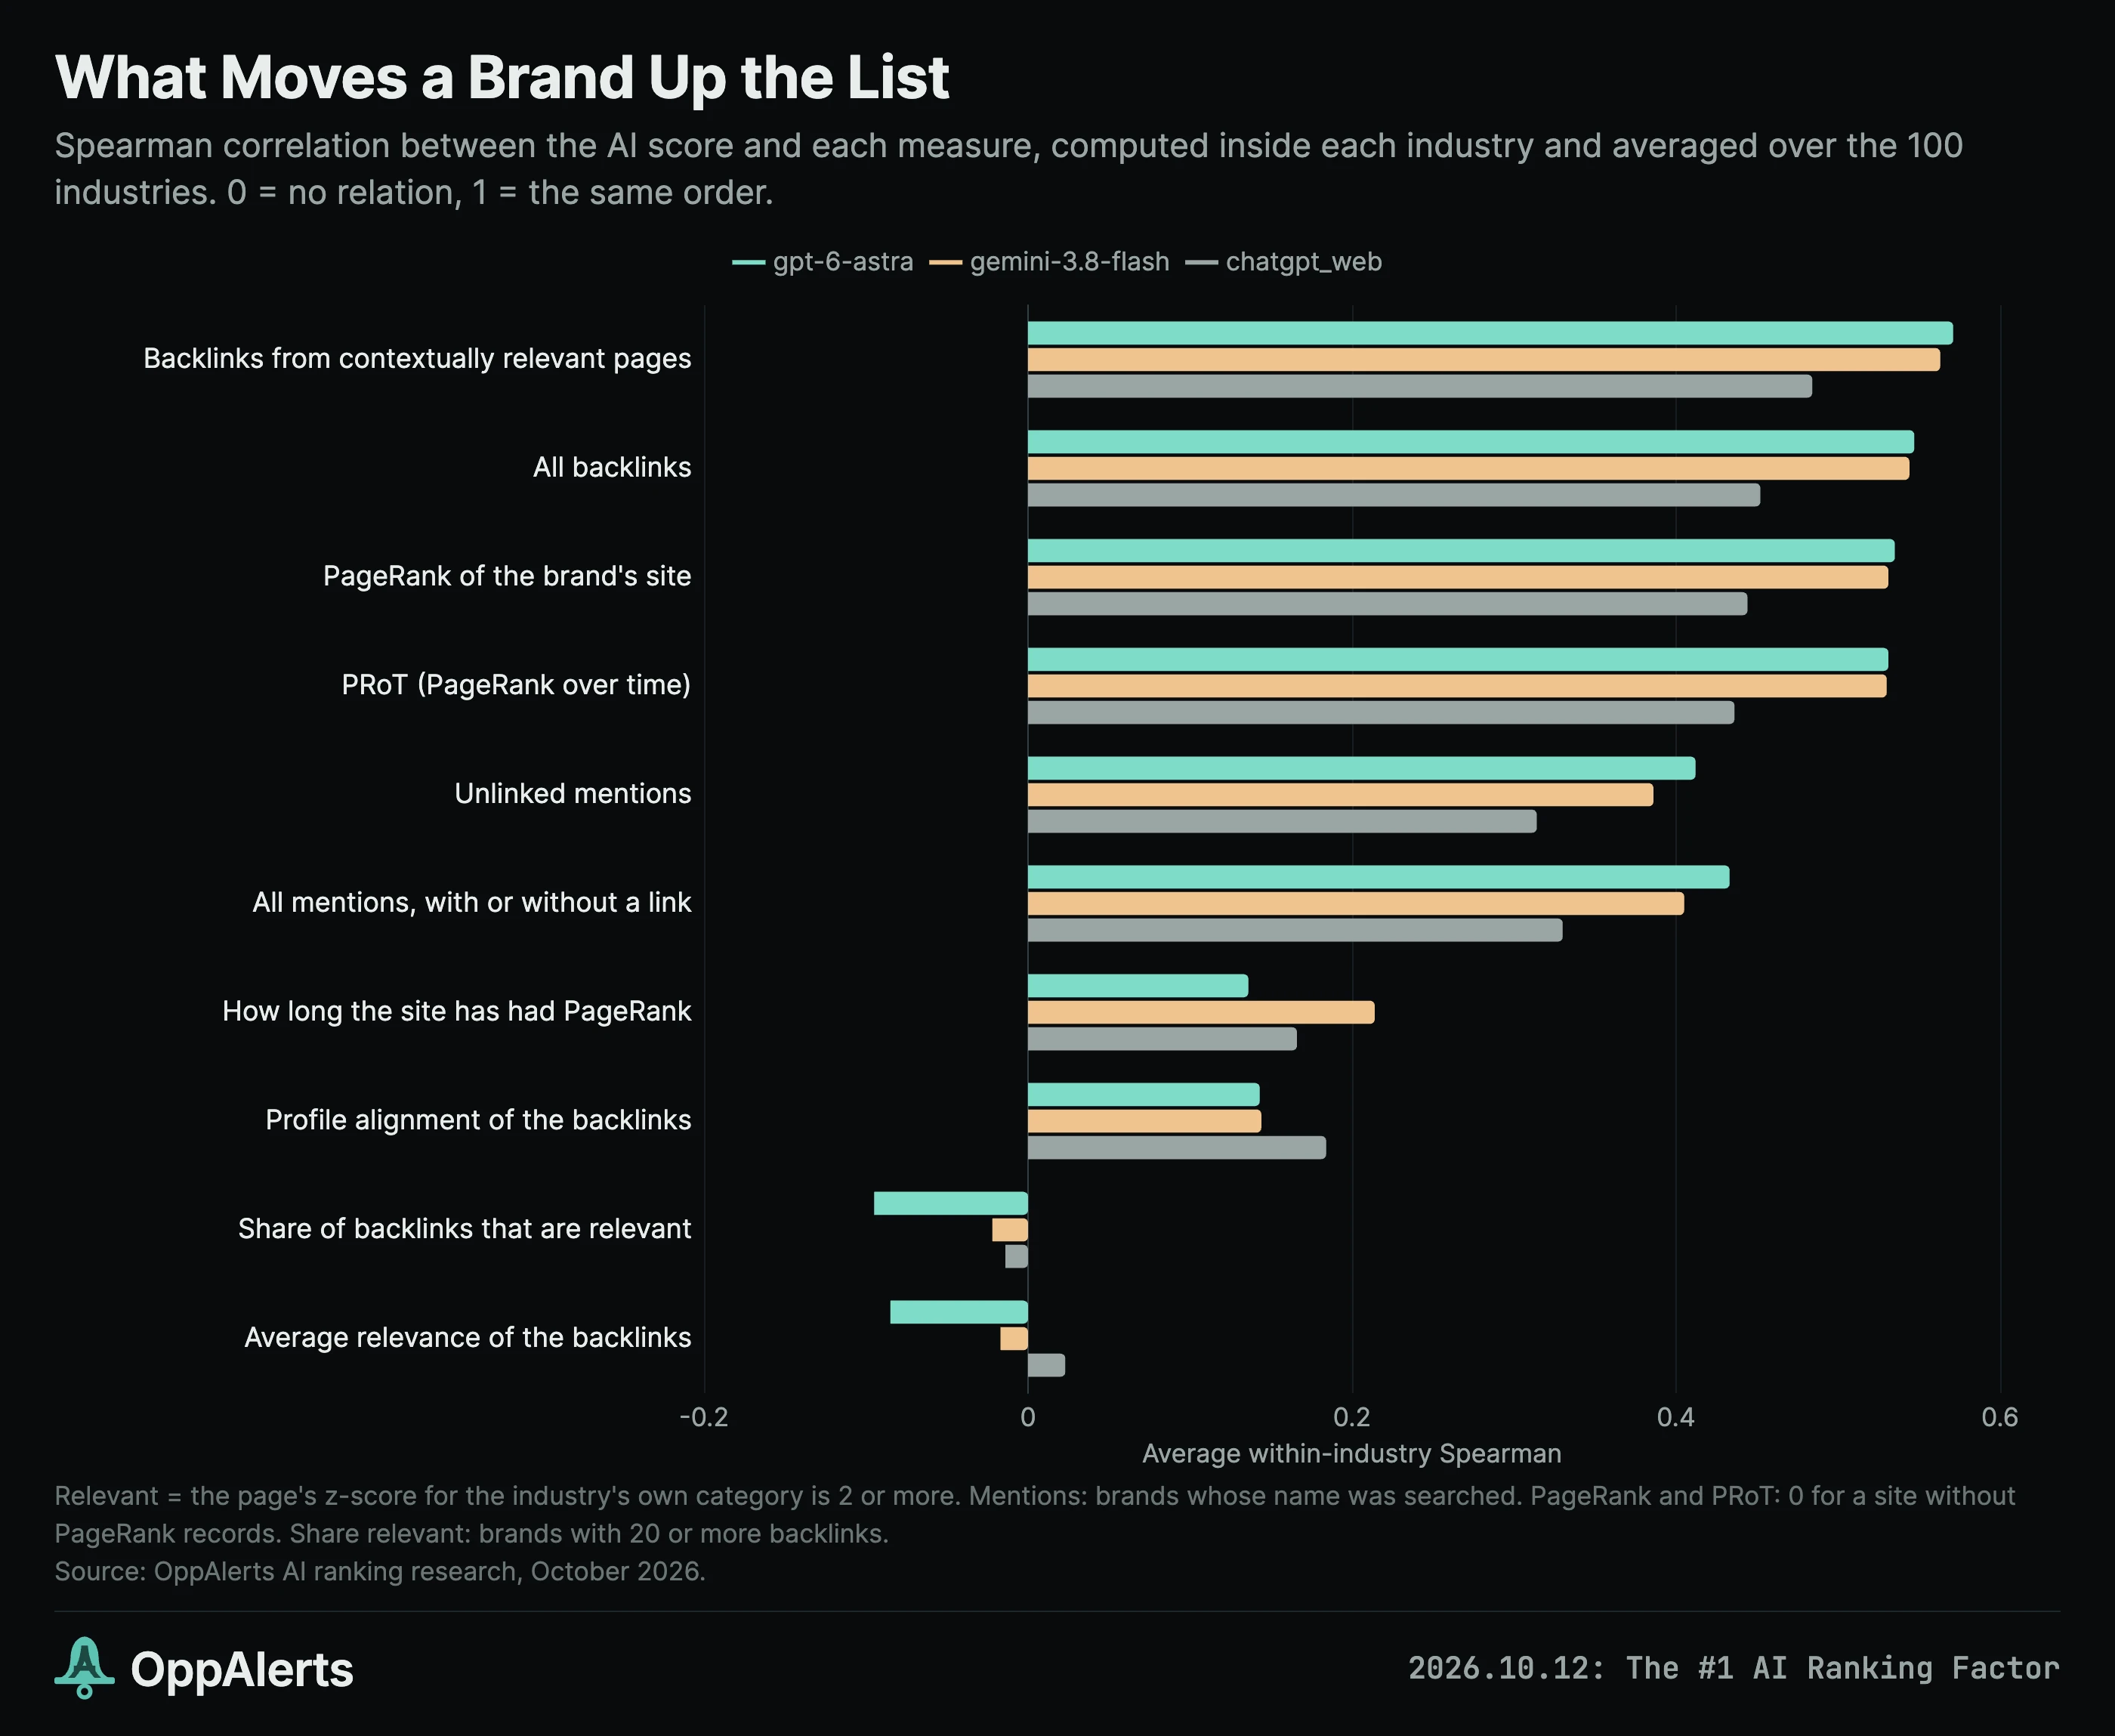
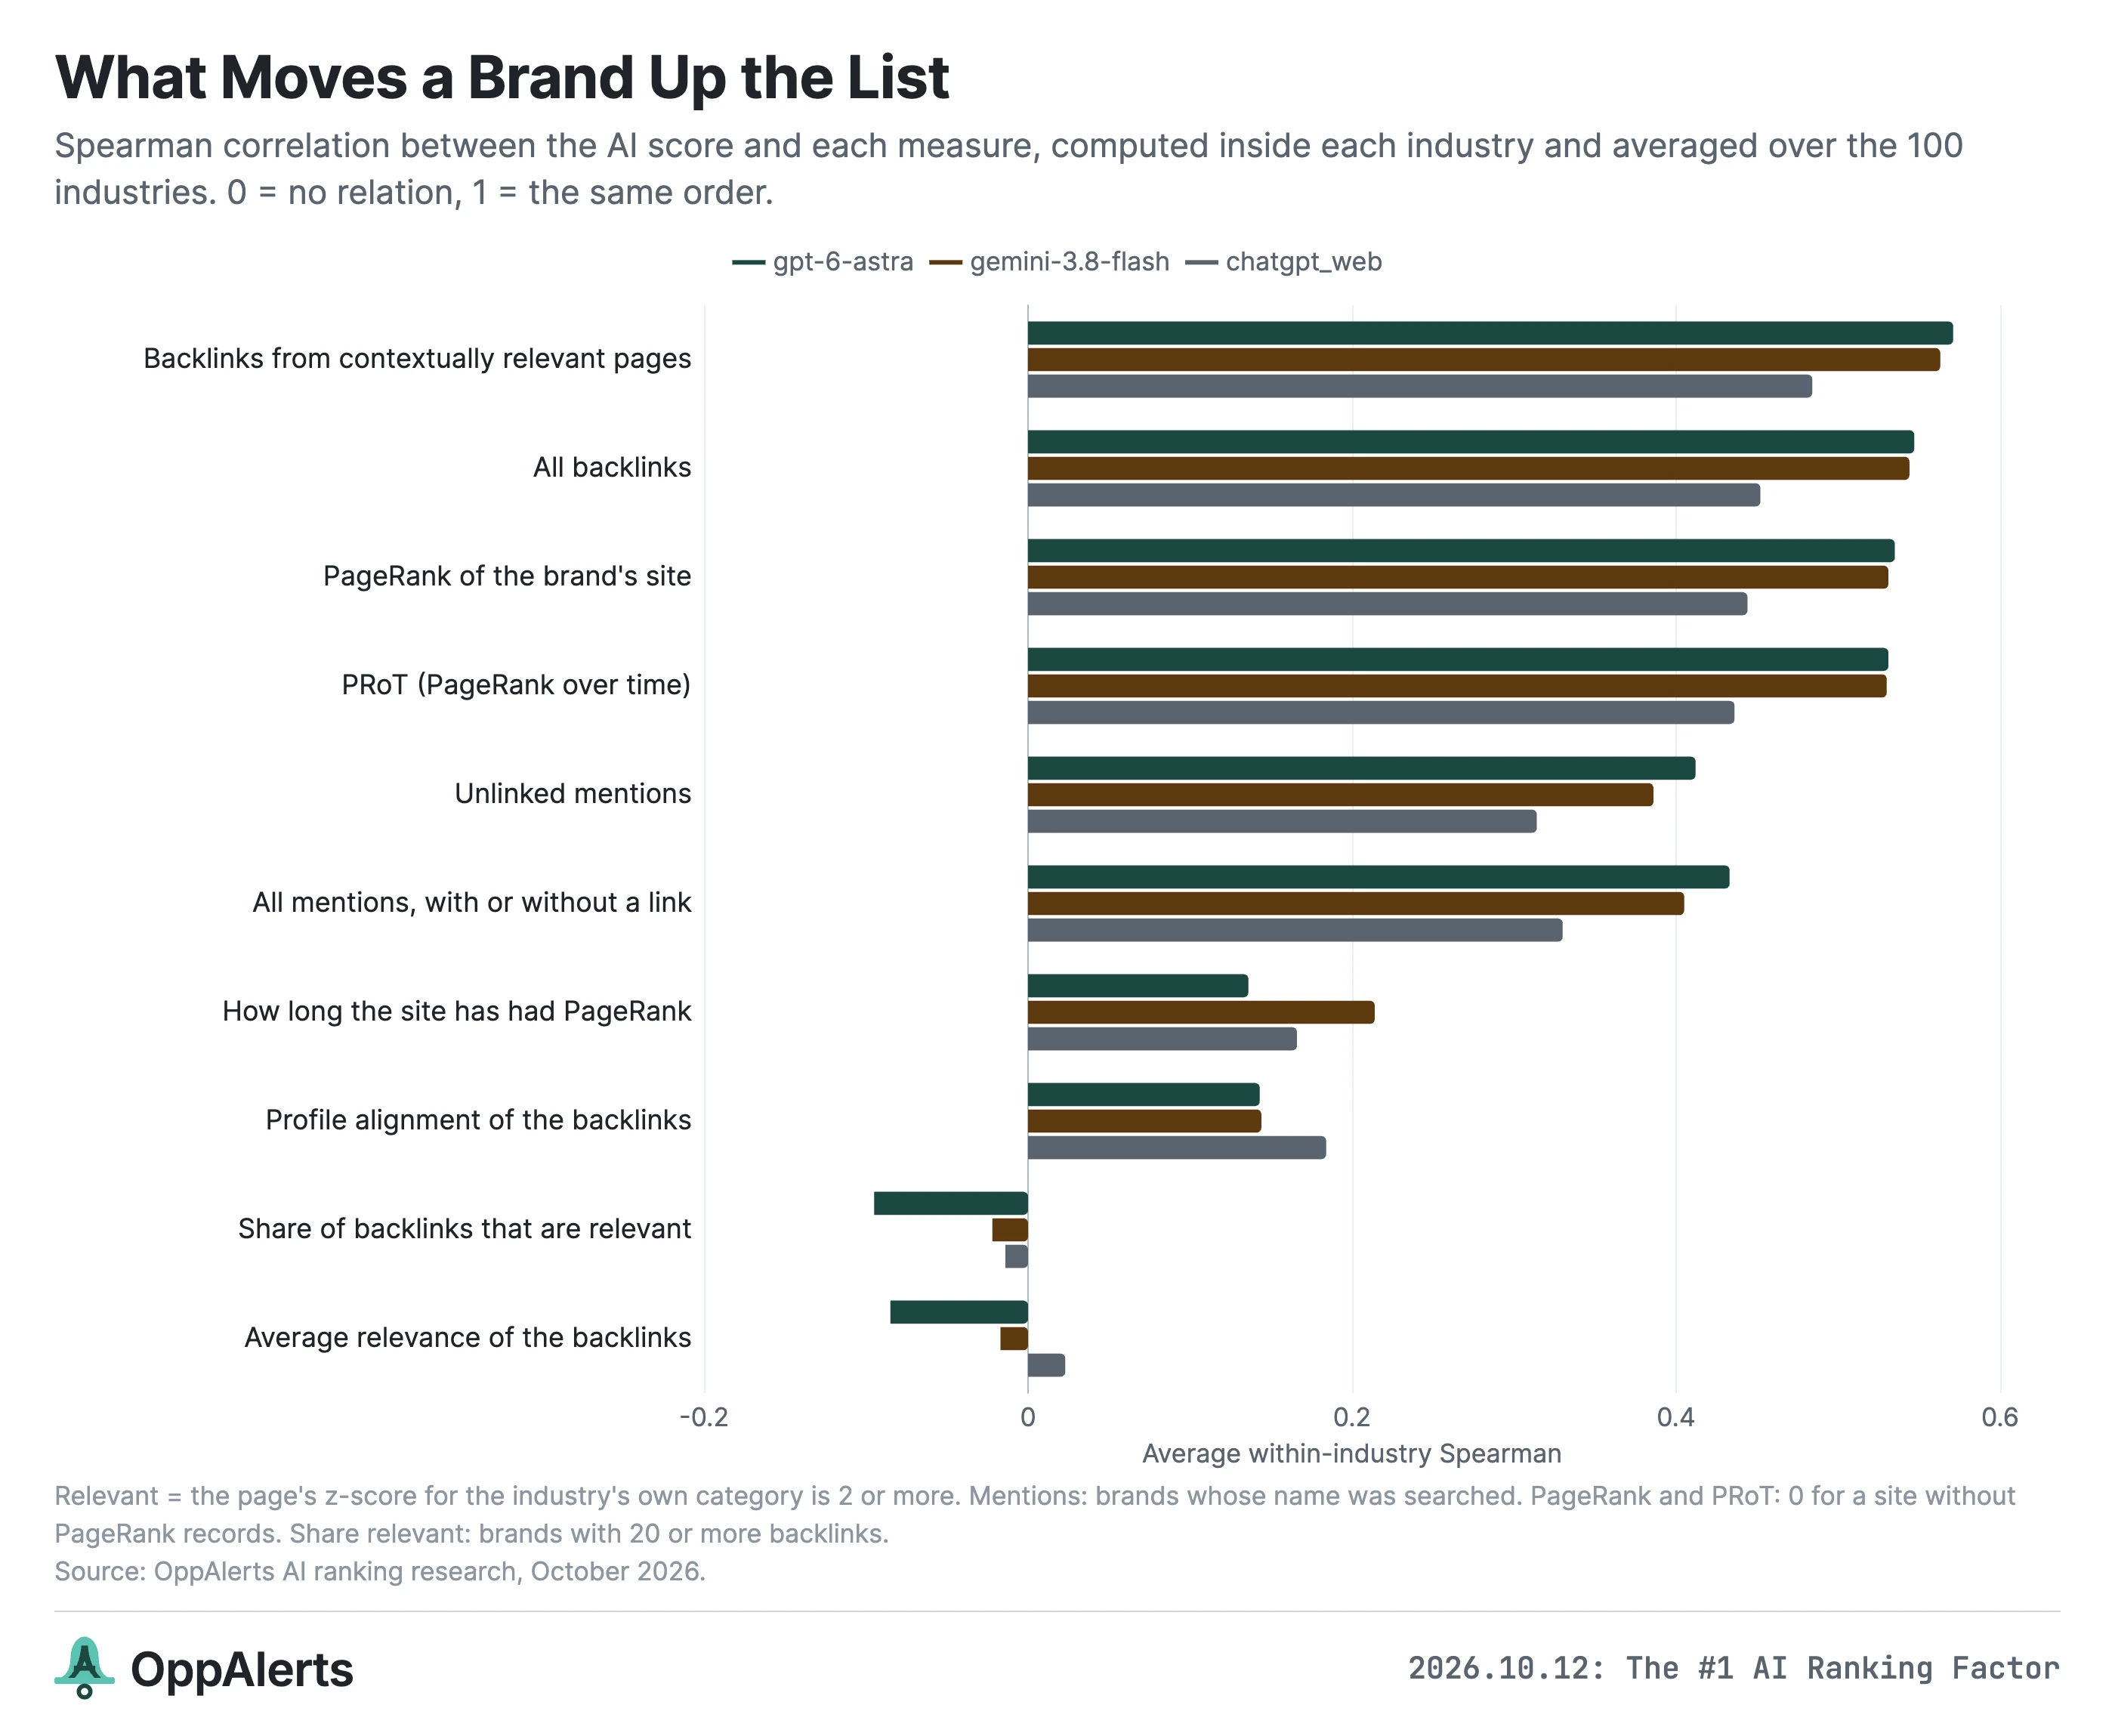
For each industry, I calculated the Spearman correlation between AI score and each measure, then averaged those correlations across the 100 industries.11
Spearman compares the order of two lists. A score of 1 means they have the same order. Zero means there's no relationship in their ordering. Here, a positive score means brands with more of the thing being measured tend to get higher AI scores.
| Measure | gpt-6-astra | gemini-3.8-flash | ChatGPT web |
|---|---|---|---|
| Backlinks from contextually relevant pages | 0.57 | 0.56 | 0.48 |
| All backlinks | 0.55 | 0.54 | 0.45 |
| PageRank of the brand's site | 0.54 | 0.53 | 0.44 |
| PRoT (PageRank over time) | 0.53 | 0.53 | 0.44 |
| All mentions, with or without a link | 0.43 | 0.41 | 0.33 |
| Unlinked mentions | 0.41 | 0.39 | 0.31 |
| How long the site has had PageRank | 0.14 | 0.21 | 0.17 |
| Profile alignment of the backlinks | 0.14 | 0.14 | 0.18 |
| Share of backlinks that are relevant | -0.10 | -0.02 | -0.01 |
| Average relevance of the backlinks | -0.09 | -0.02 | 0.02 |
The number of backlinks from contextually relevant pages is the strongest measure in every one of the 17 AI channels.
For GPT-6 Astra, that correlation is 0.57. For Gemini 3.8 Flash, it's 0.56. For ChatGPT through the web interface, it's 0.48.
You might notice that total link count is pretty close behind. Relevant links are only 0.02 to 0.04 ahead, depending on the model.
So I checked whether relevance still adds anything after accounting for the total number of links. It does. That partial correlation is 0.18 to 0.20 across the GPT-6 models, Gemini Flash models, and ChatGPT web.12
In other words, when two brands have similar numbers of backlinks, the brand with more backlinks from pages about its industry tends to rank higher.
For GPT-6 Astra, the relationship between relevant backlink count and AI score is positive in all 100 industries. It ranges from 0.20 for personal loan and fintech lenders to 0.87 for ERP software. Hotels and resorts are at 0.50.
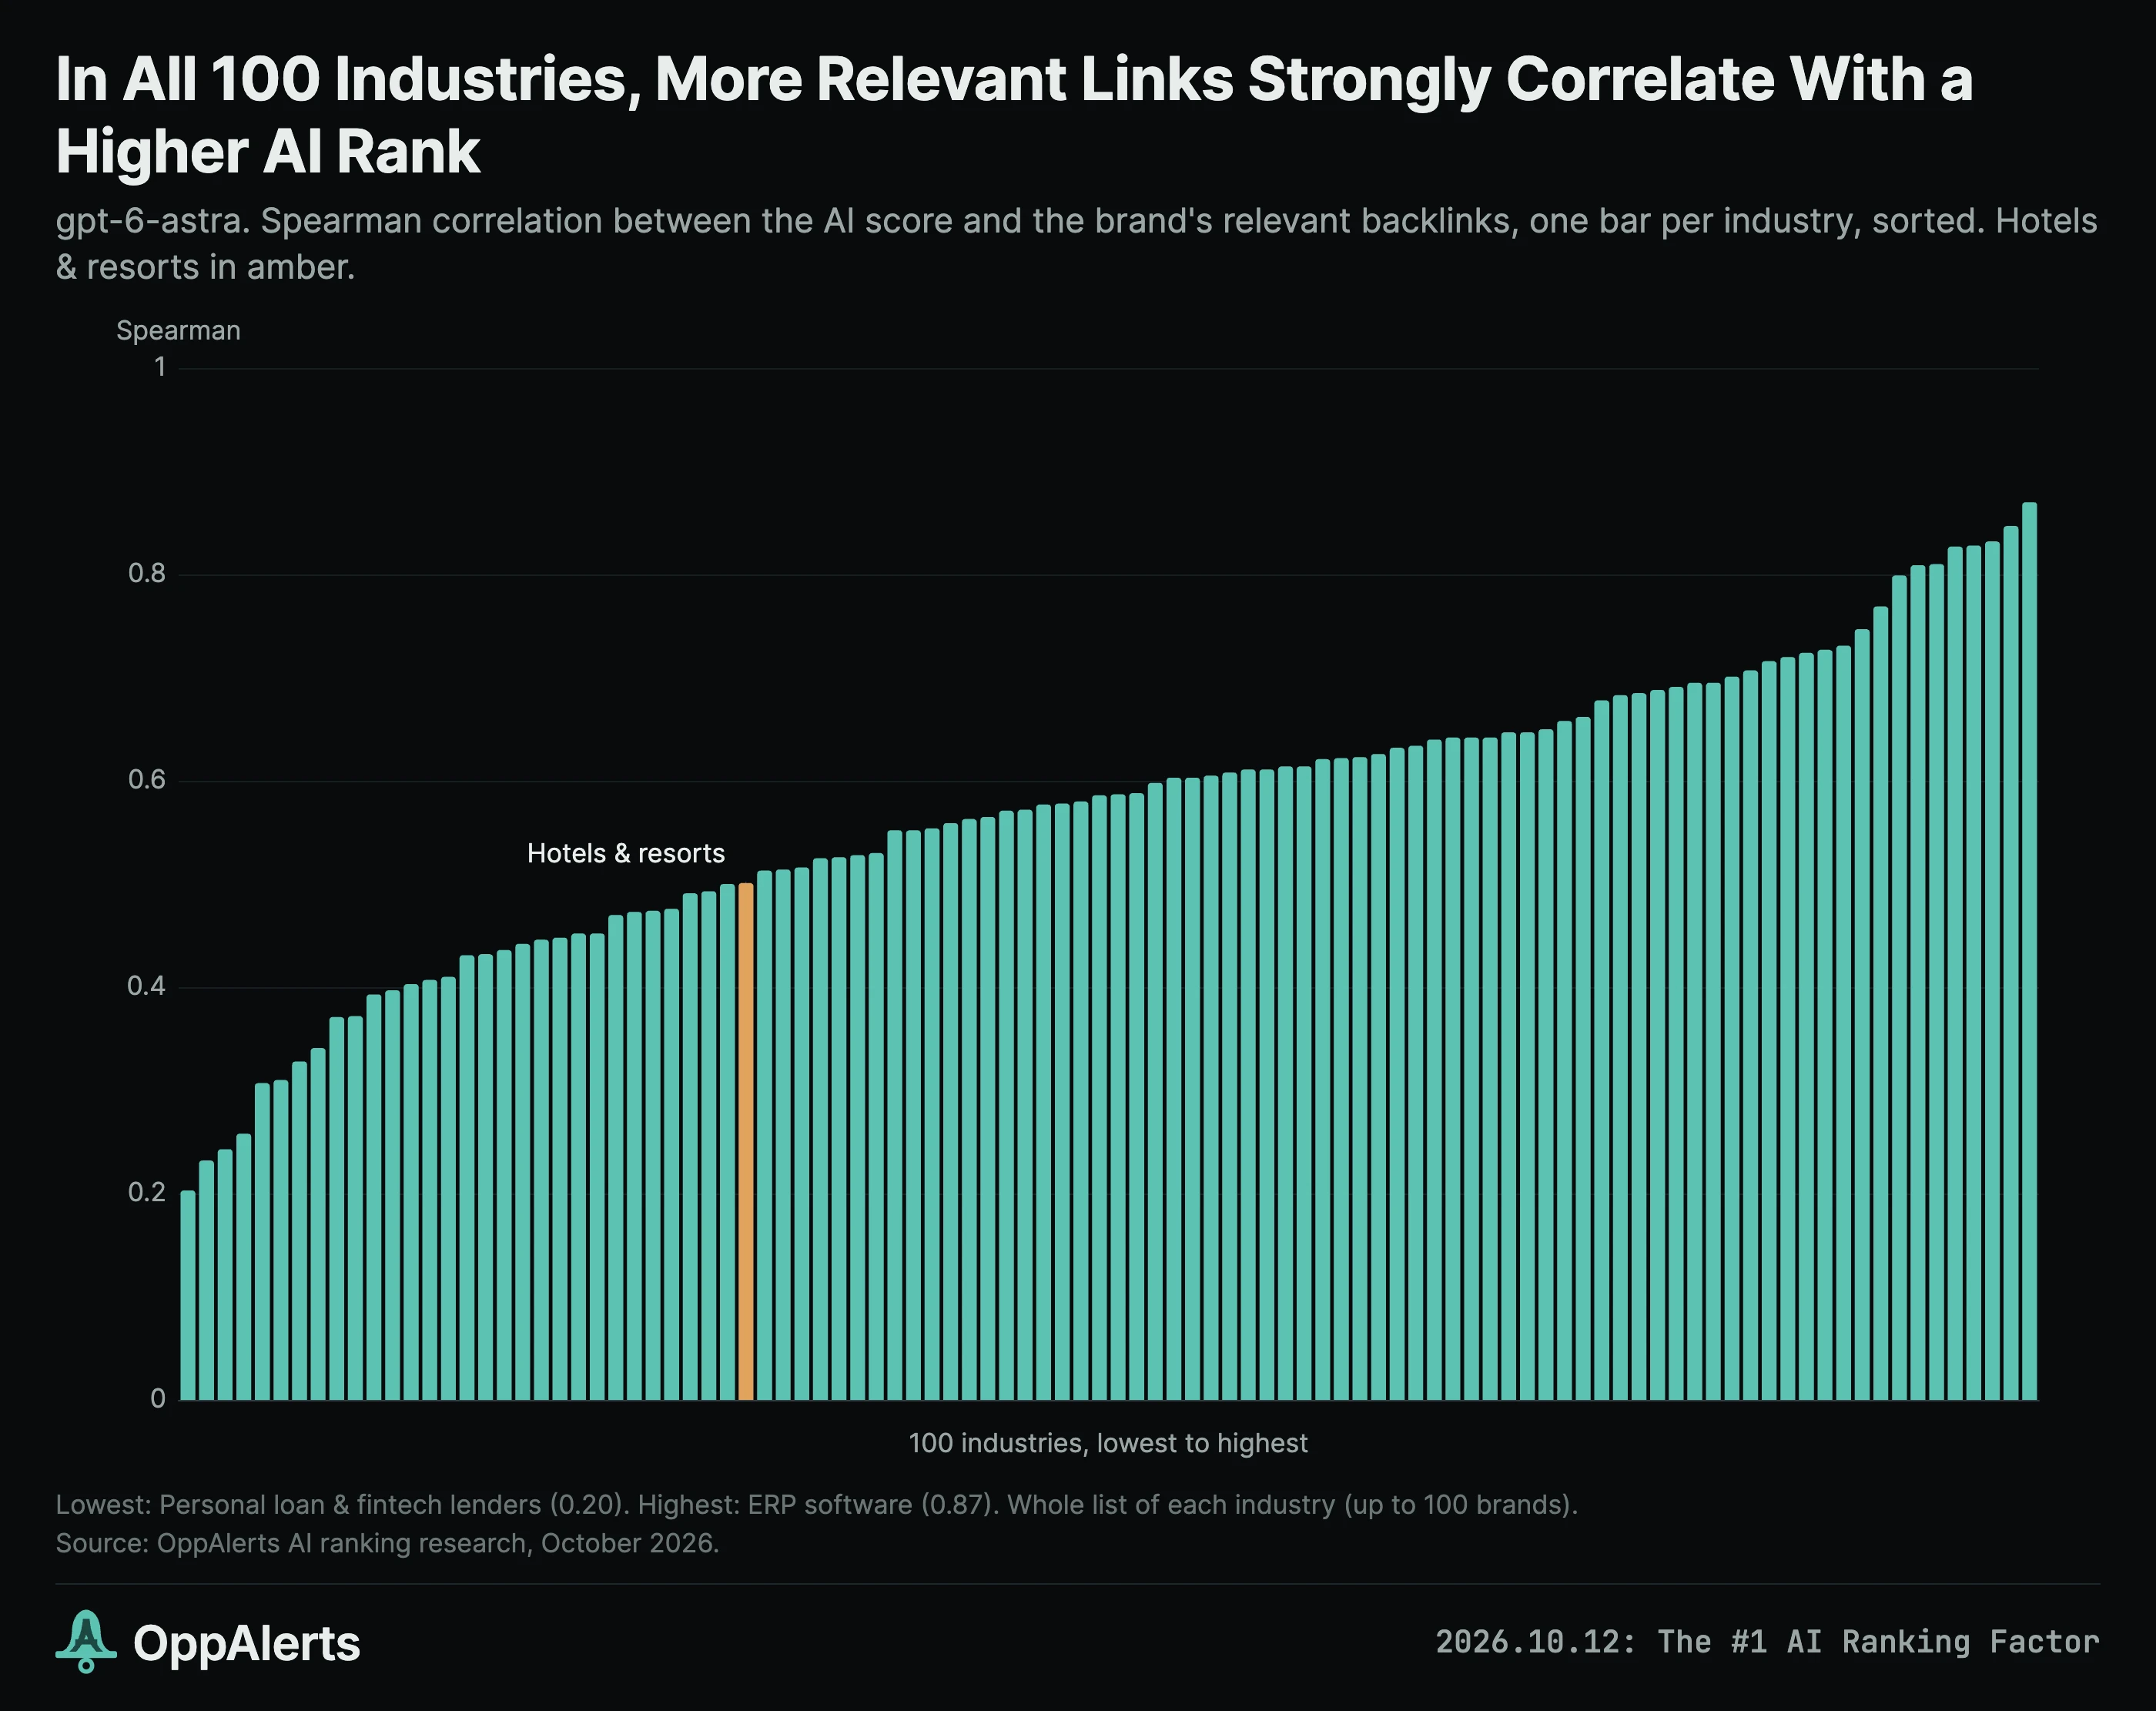
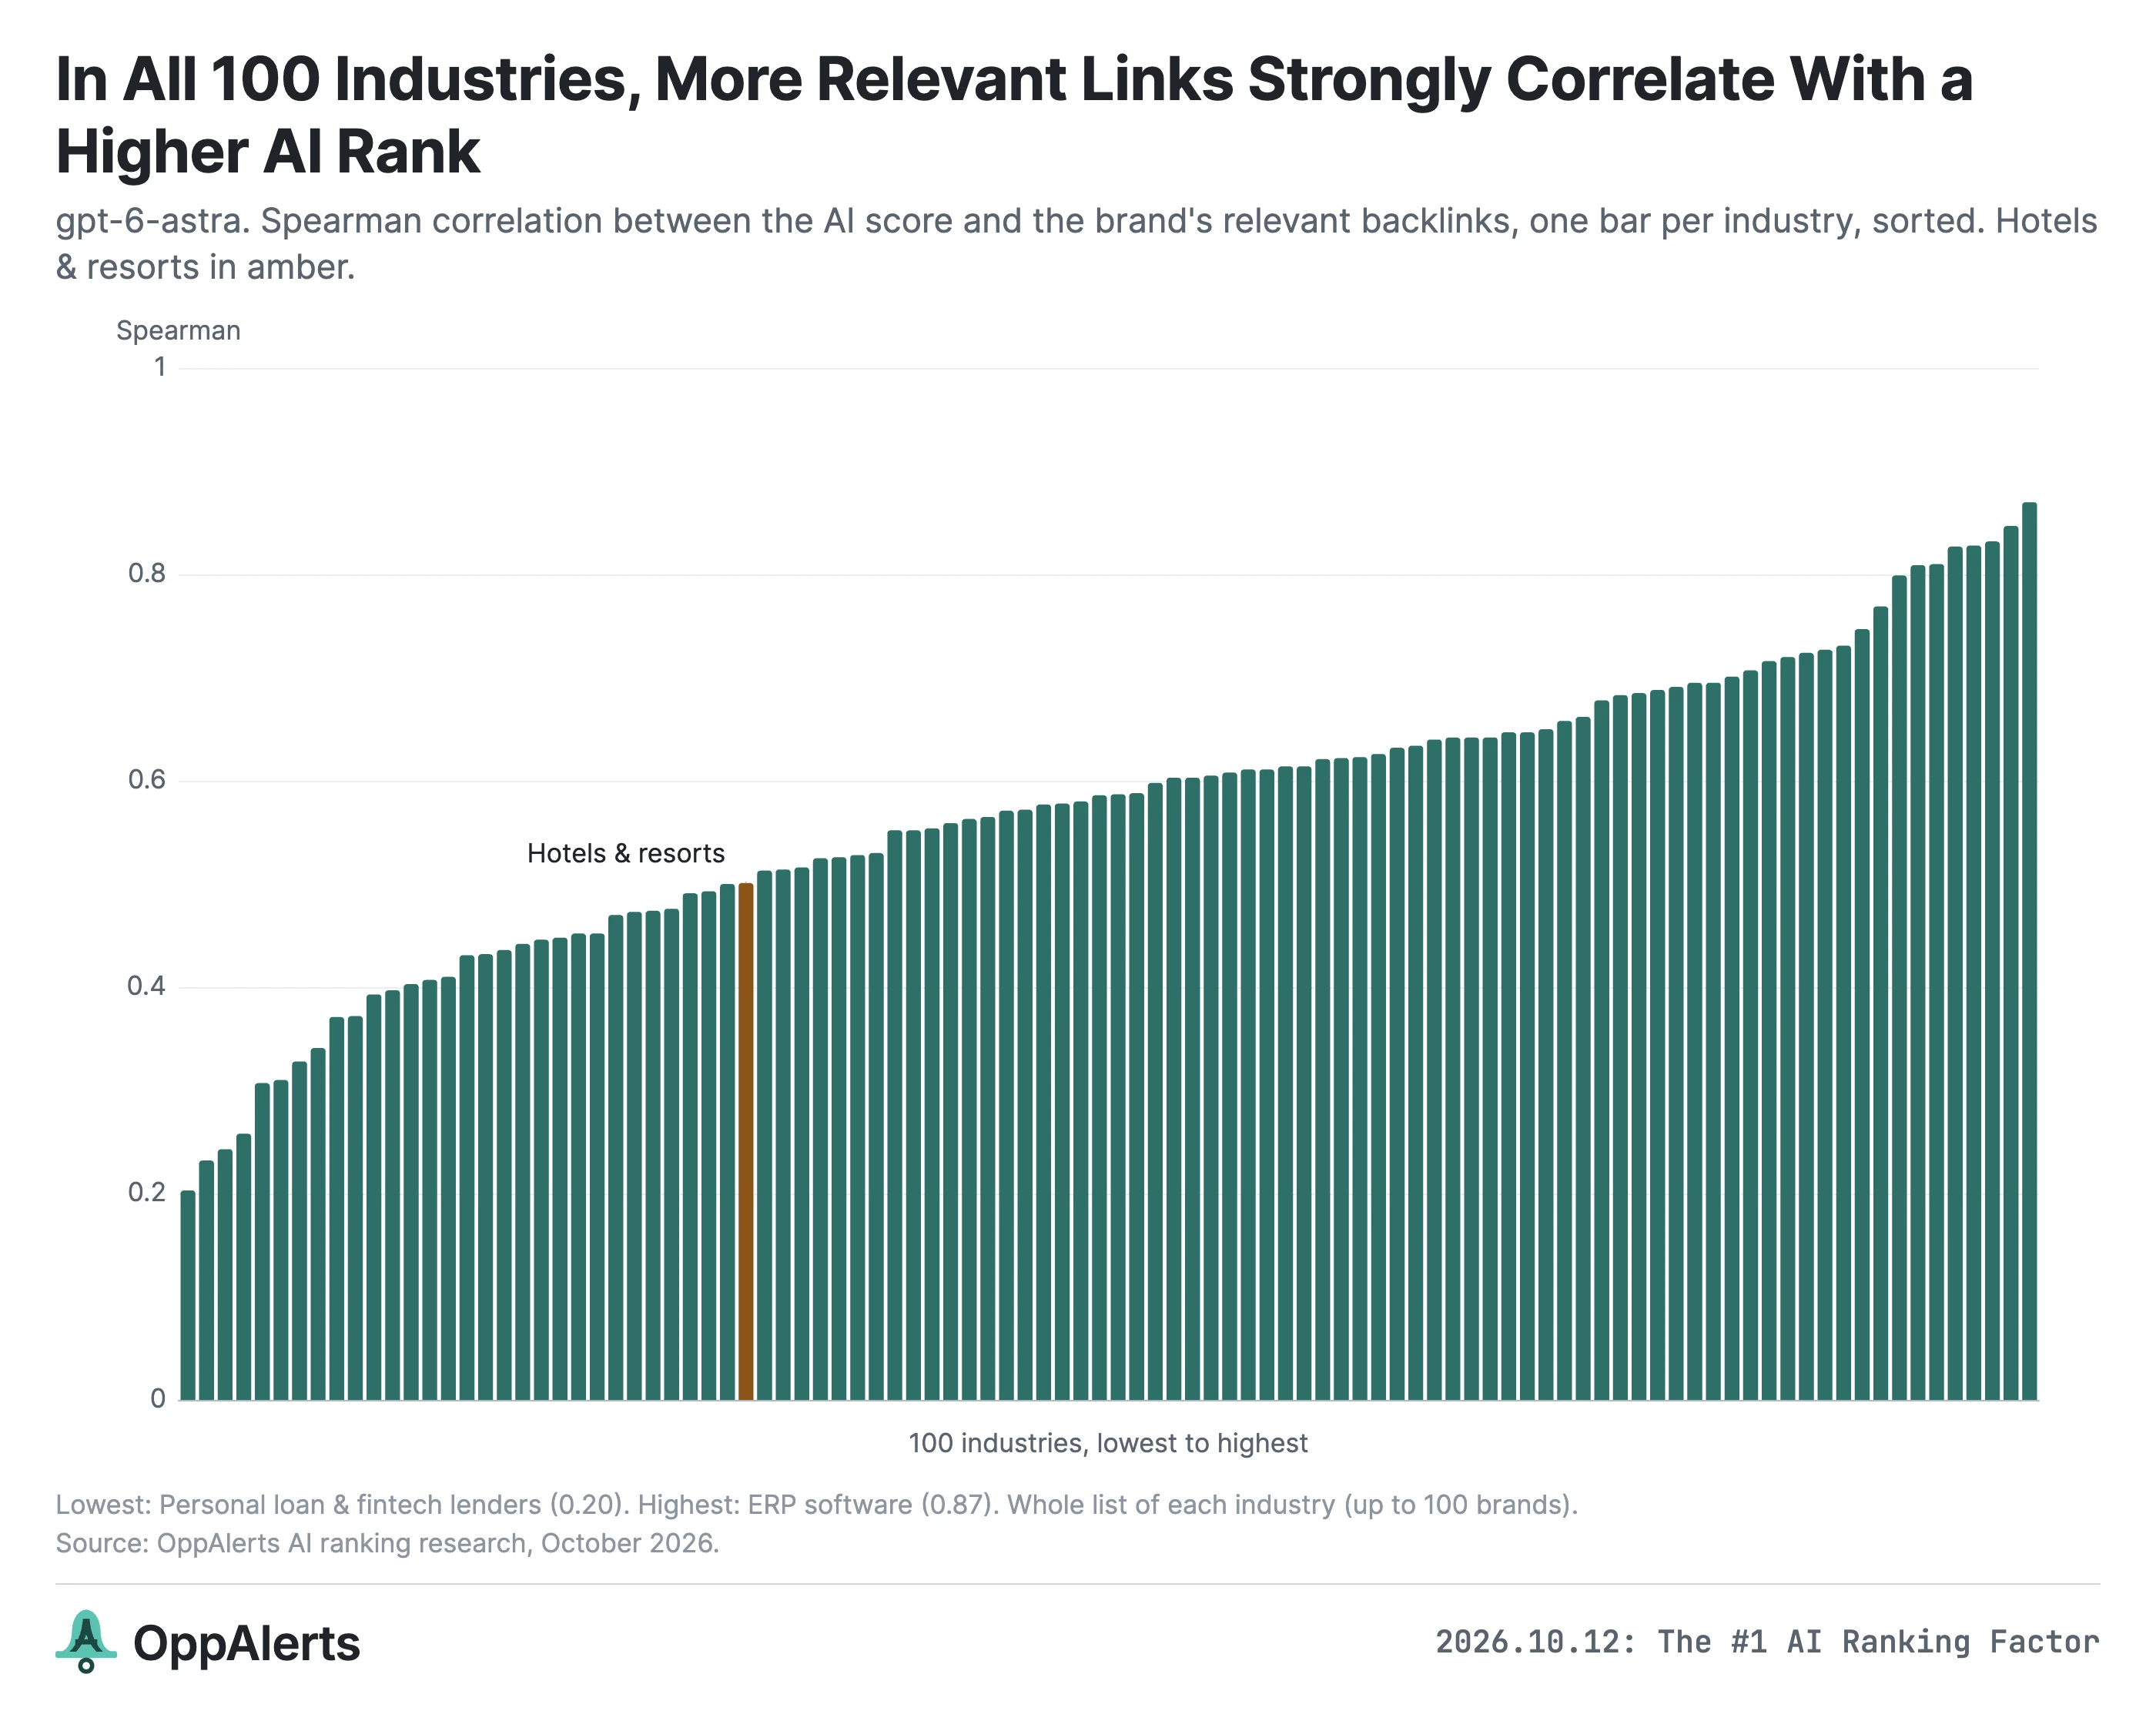
That's a useful relationship to build a campaign around. It also leaves plenty of room for other things to matter. You saw that in the hotel table: some brands with fewer links rank above brands with more.
A more focused backlink profile isn't enough on its own
There's something in that table that needs a little explanation.
The average relevance of a brand's backlinks has almost no relationship with its AI rank. Neither does the percentage of its backlinks that are relevant.
For GPT-6 Astra, those correlations are slightly negative: -0.09 and -0.10.
That might seem odd after everything I just showed you. But think about what happens as a brand gets bigger. More people write about it, in more contexts. Its backlink profile gets broader.
Let's use Marriott and Kimpton.
Marriott is GPT-6 Astra's first hotel recommendation. It has 18,529 backlinks in the indexes. Of the 18,425 backlinks scored, 10,083 come from pages strongly about hotels. That's about 55%.
Kimpton is at rank 51. It has 523 backlinks, and 488 come from pages strongly about hotels. That's 93%.
Kimpton has the more focused profile. Its hotel category is 4.3 standard deviations above its page average, compared with Marriott's 2.6.
Marriott still has about 21 times as many relevant backlinks.
This happens across industries. Among brands with 21 to 100 backlinks, 88% have their own industry's category in the top 1% of their 2,558 categories. Among brands with more than 10,000 backlinks, only 38% do.
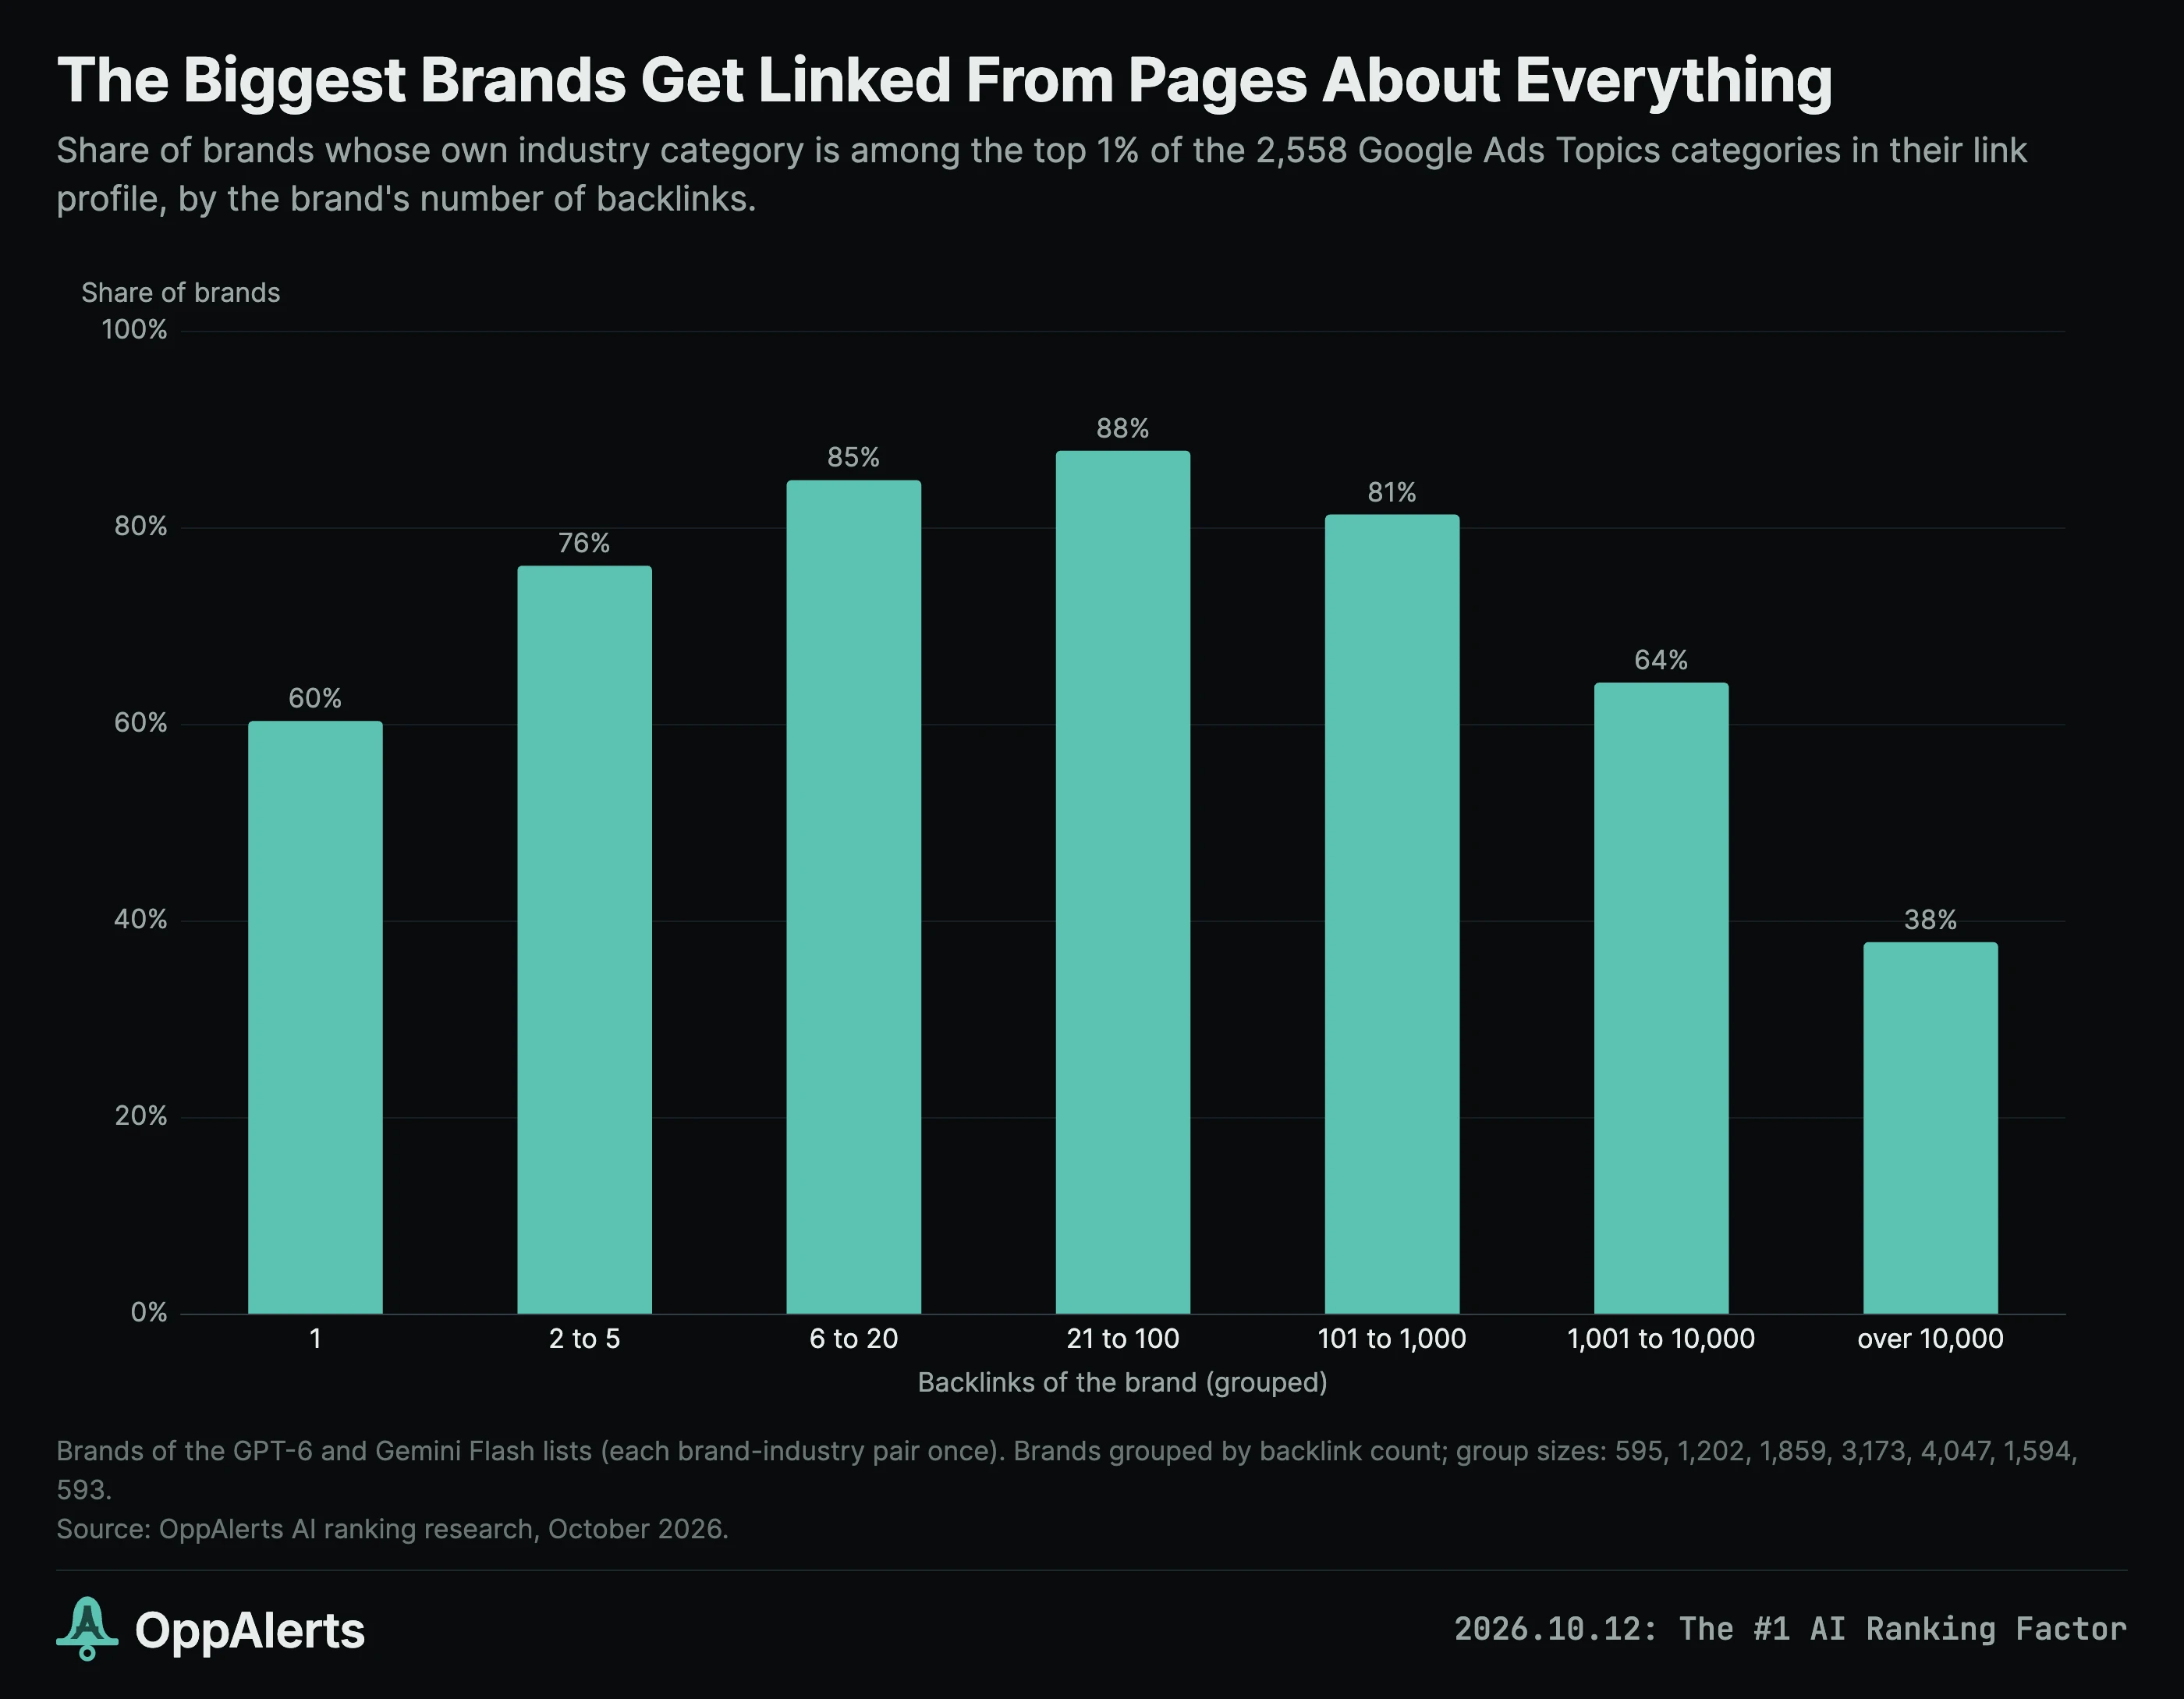
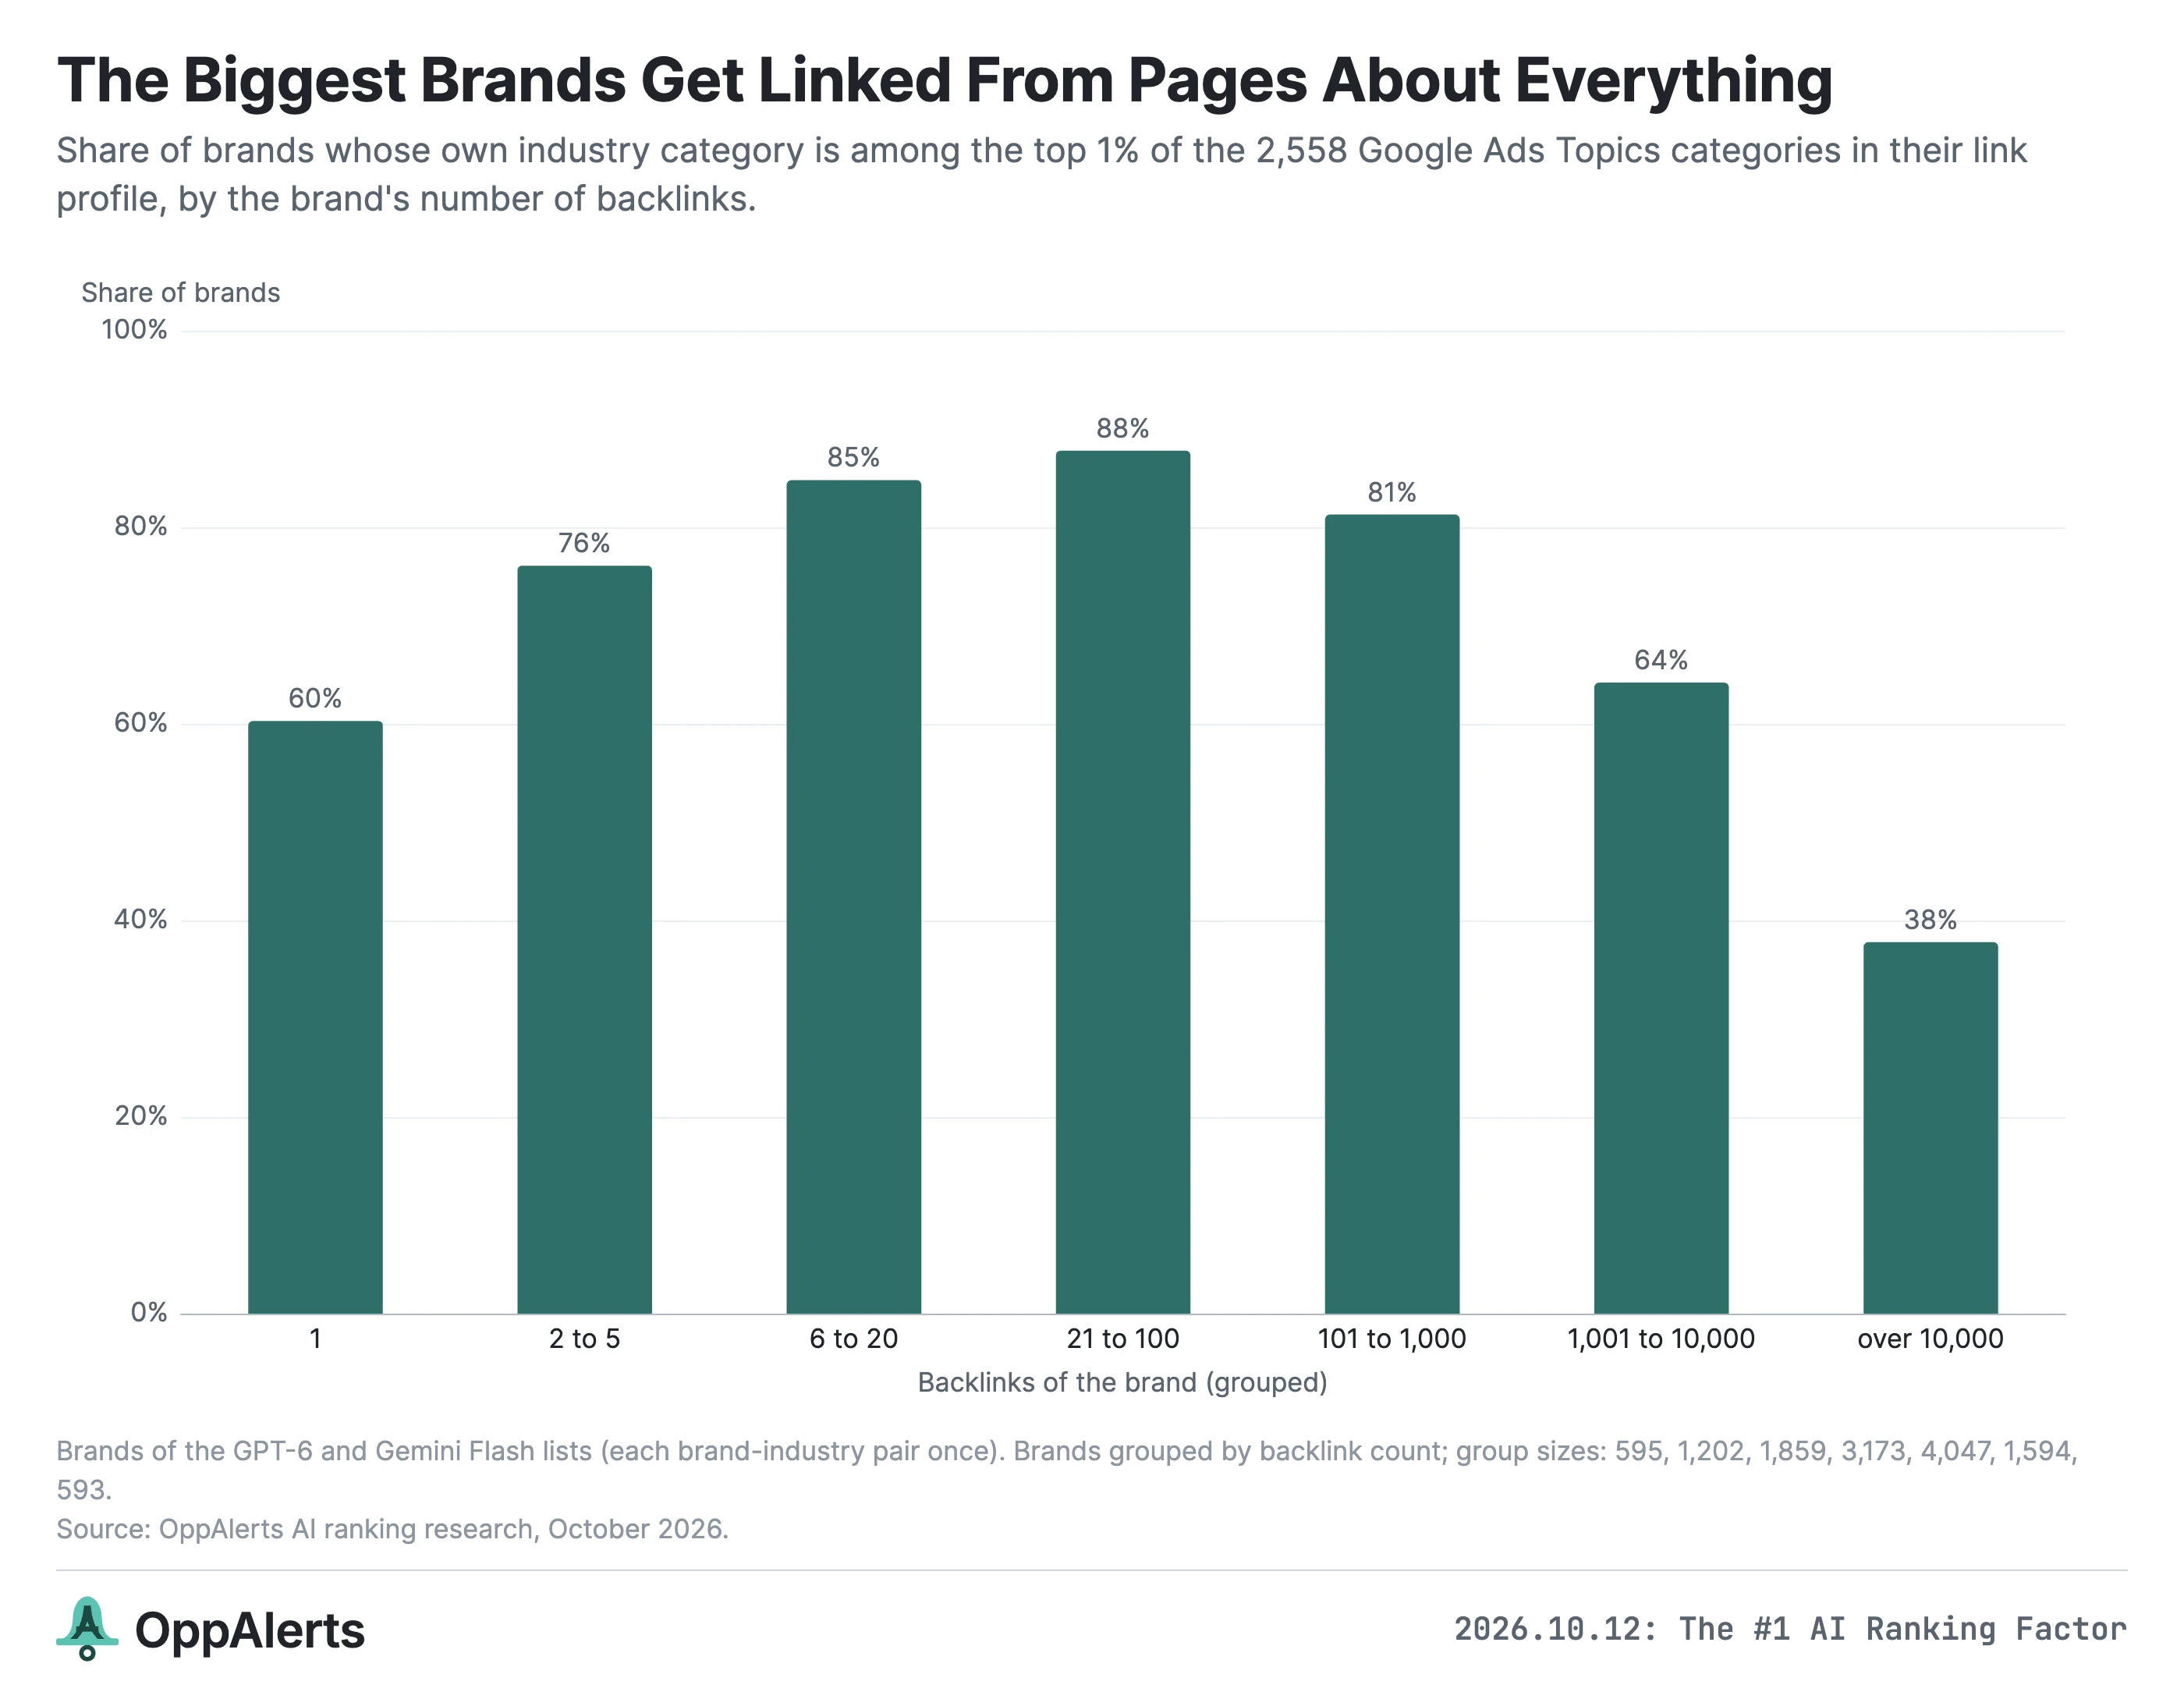
Marriott's profile includes Corporate Events and Business Travel alongside Hotels. That makes sense. People have more reasons to write about a large hotel brand than whether it's a good place to spend the night.
So when you're choosing where to put your effort, look for more relevant opportunities. A small, tightly focused backlink profile doesn't automatically beat a broad one with thousands of relevant backlinks.
This research doesn't establish whether unrelated links help or hurt. It gives us a reason to prioritize backlinks from relevant pages, without treating every other mention of your business as a problem.
PageRank follows the rankings too
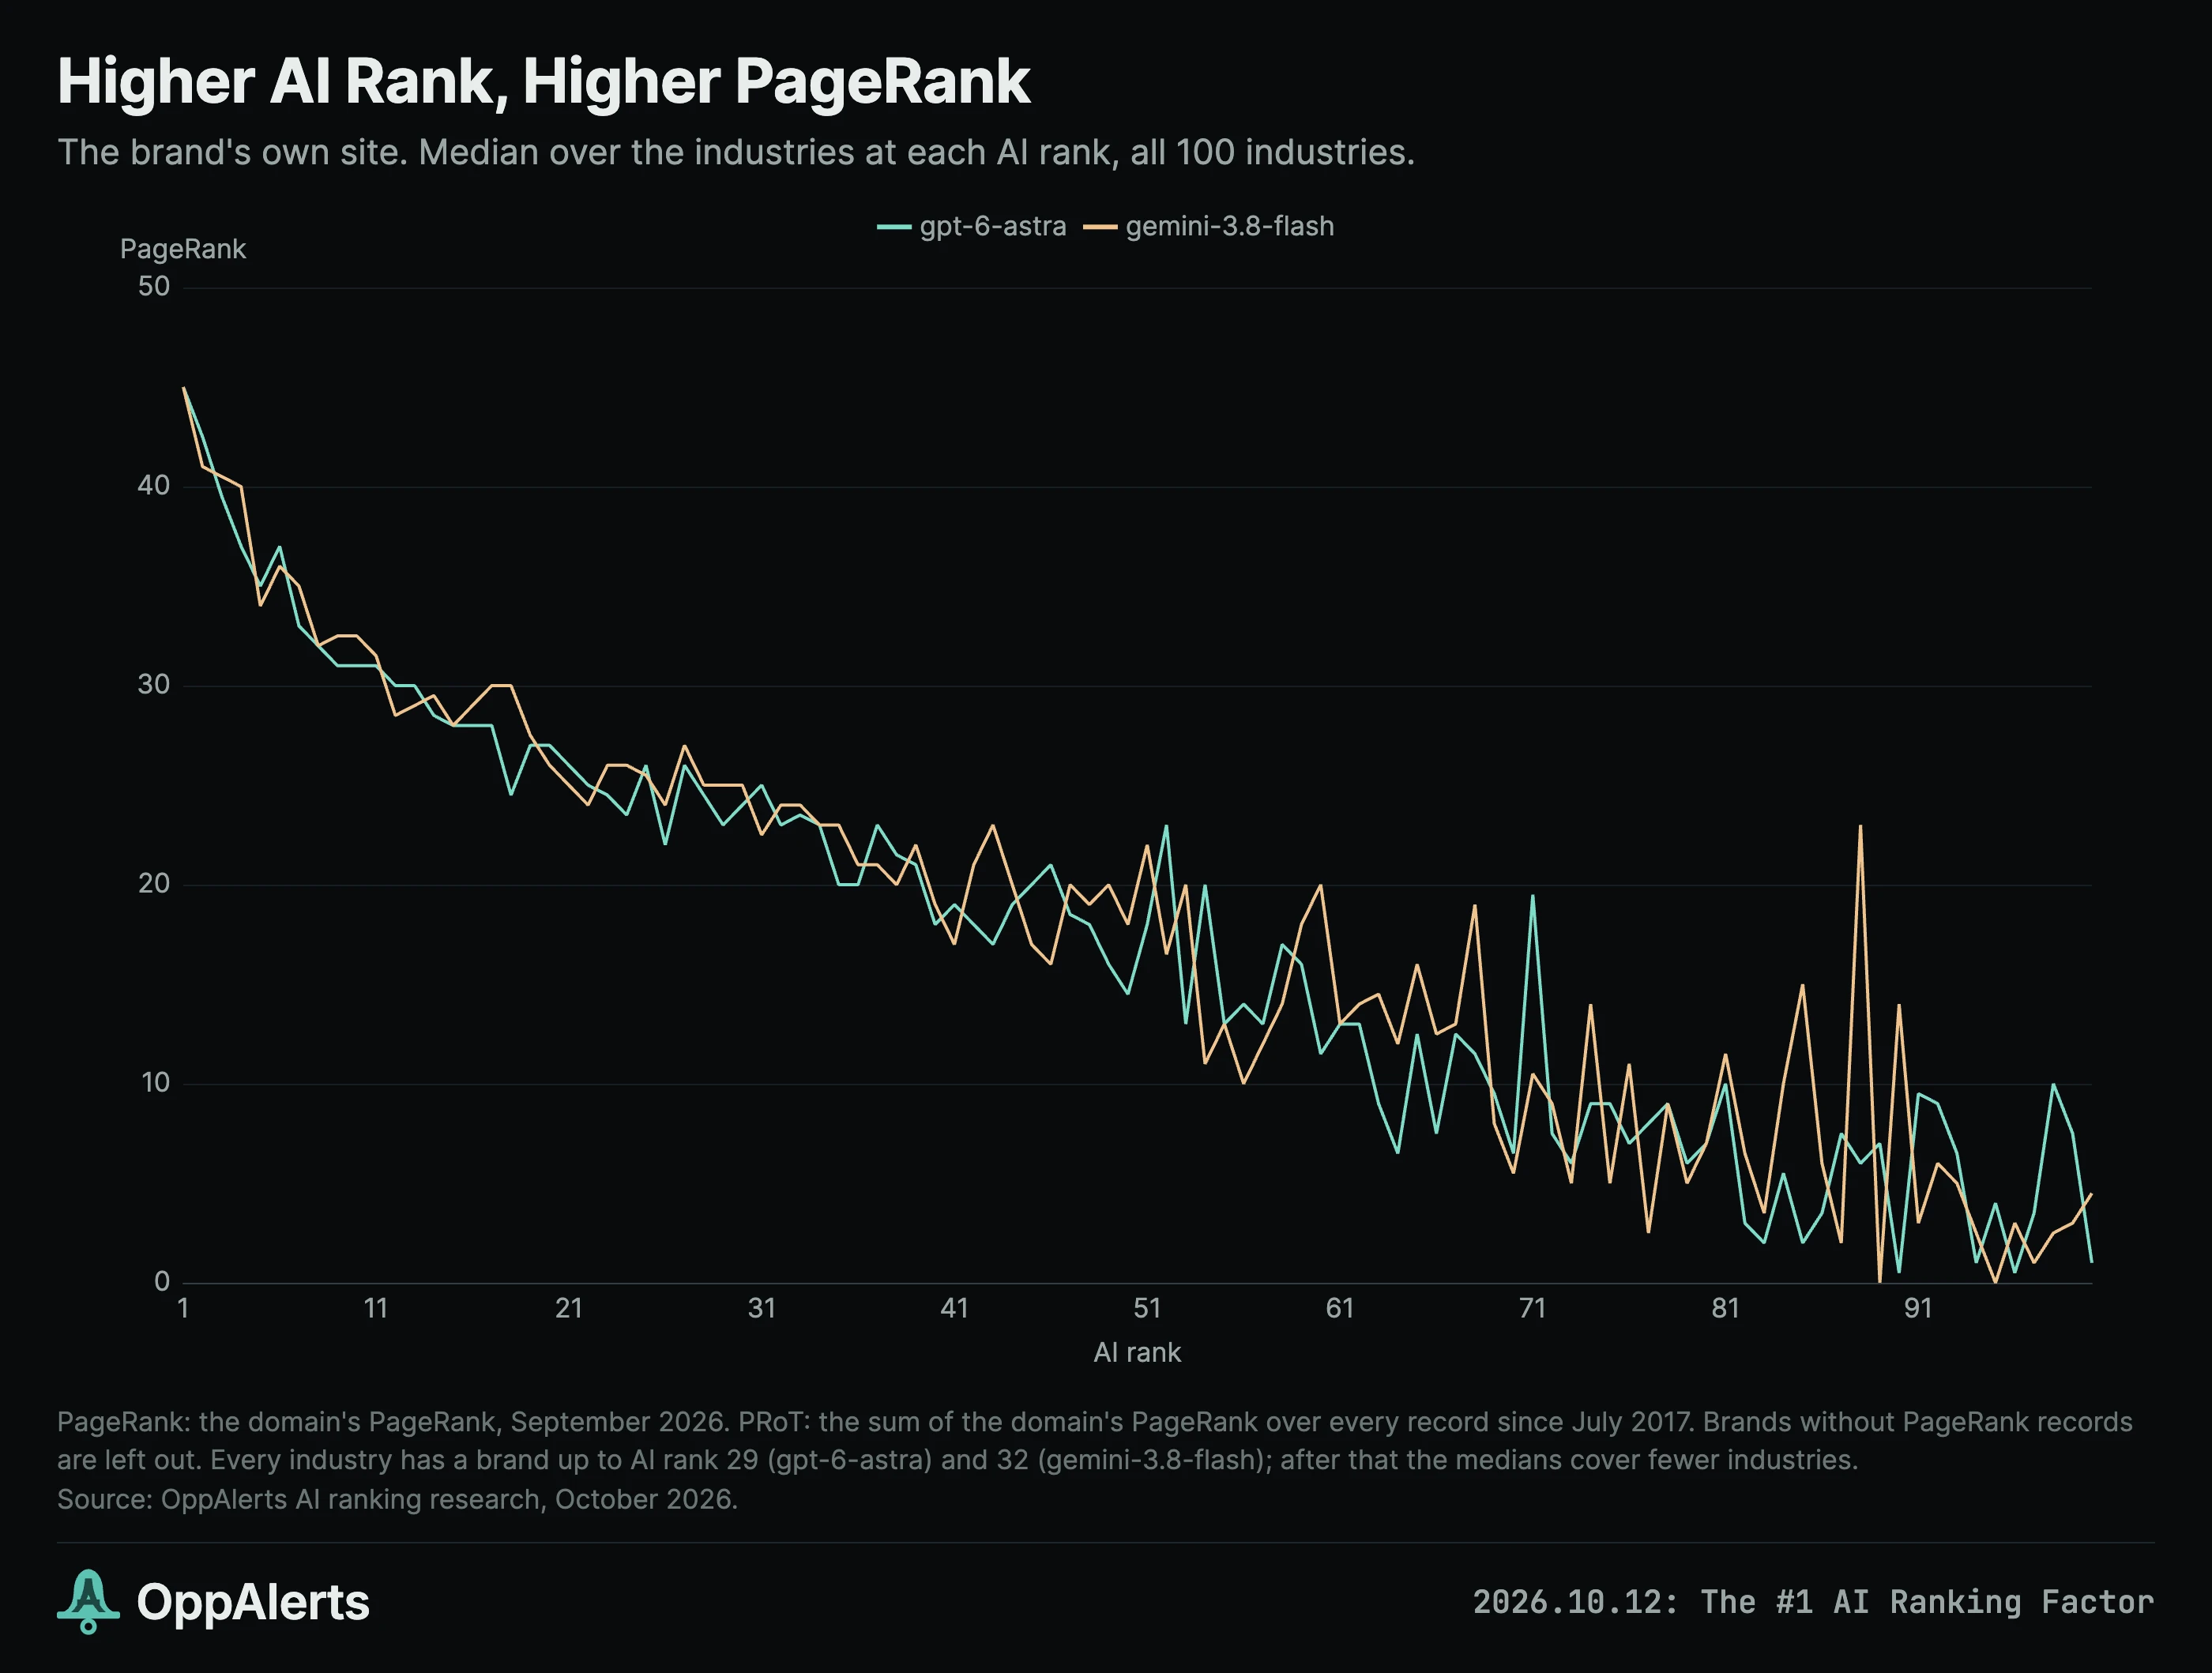
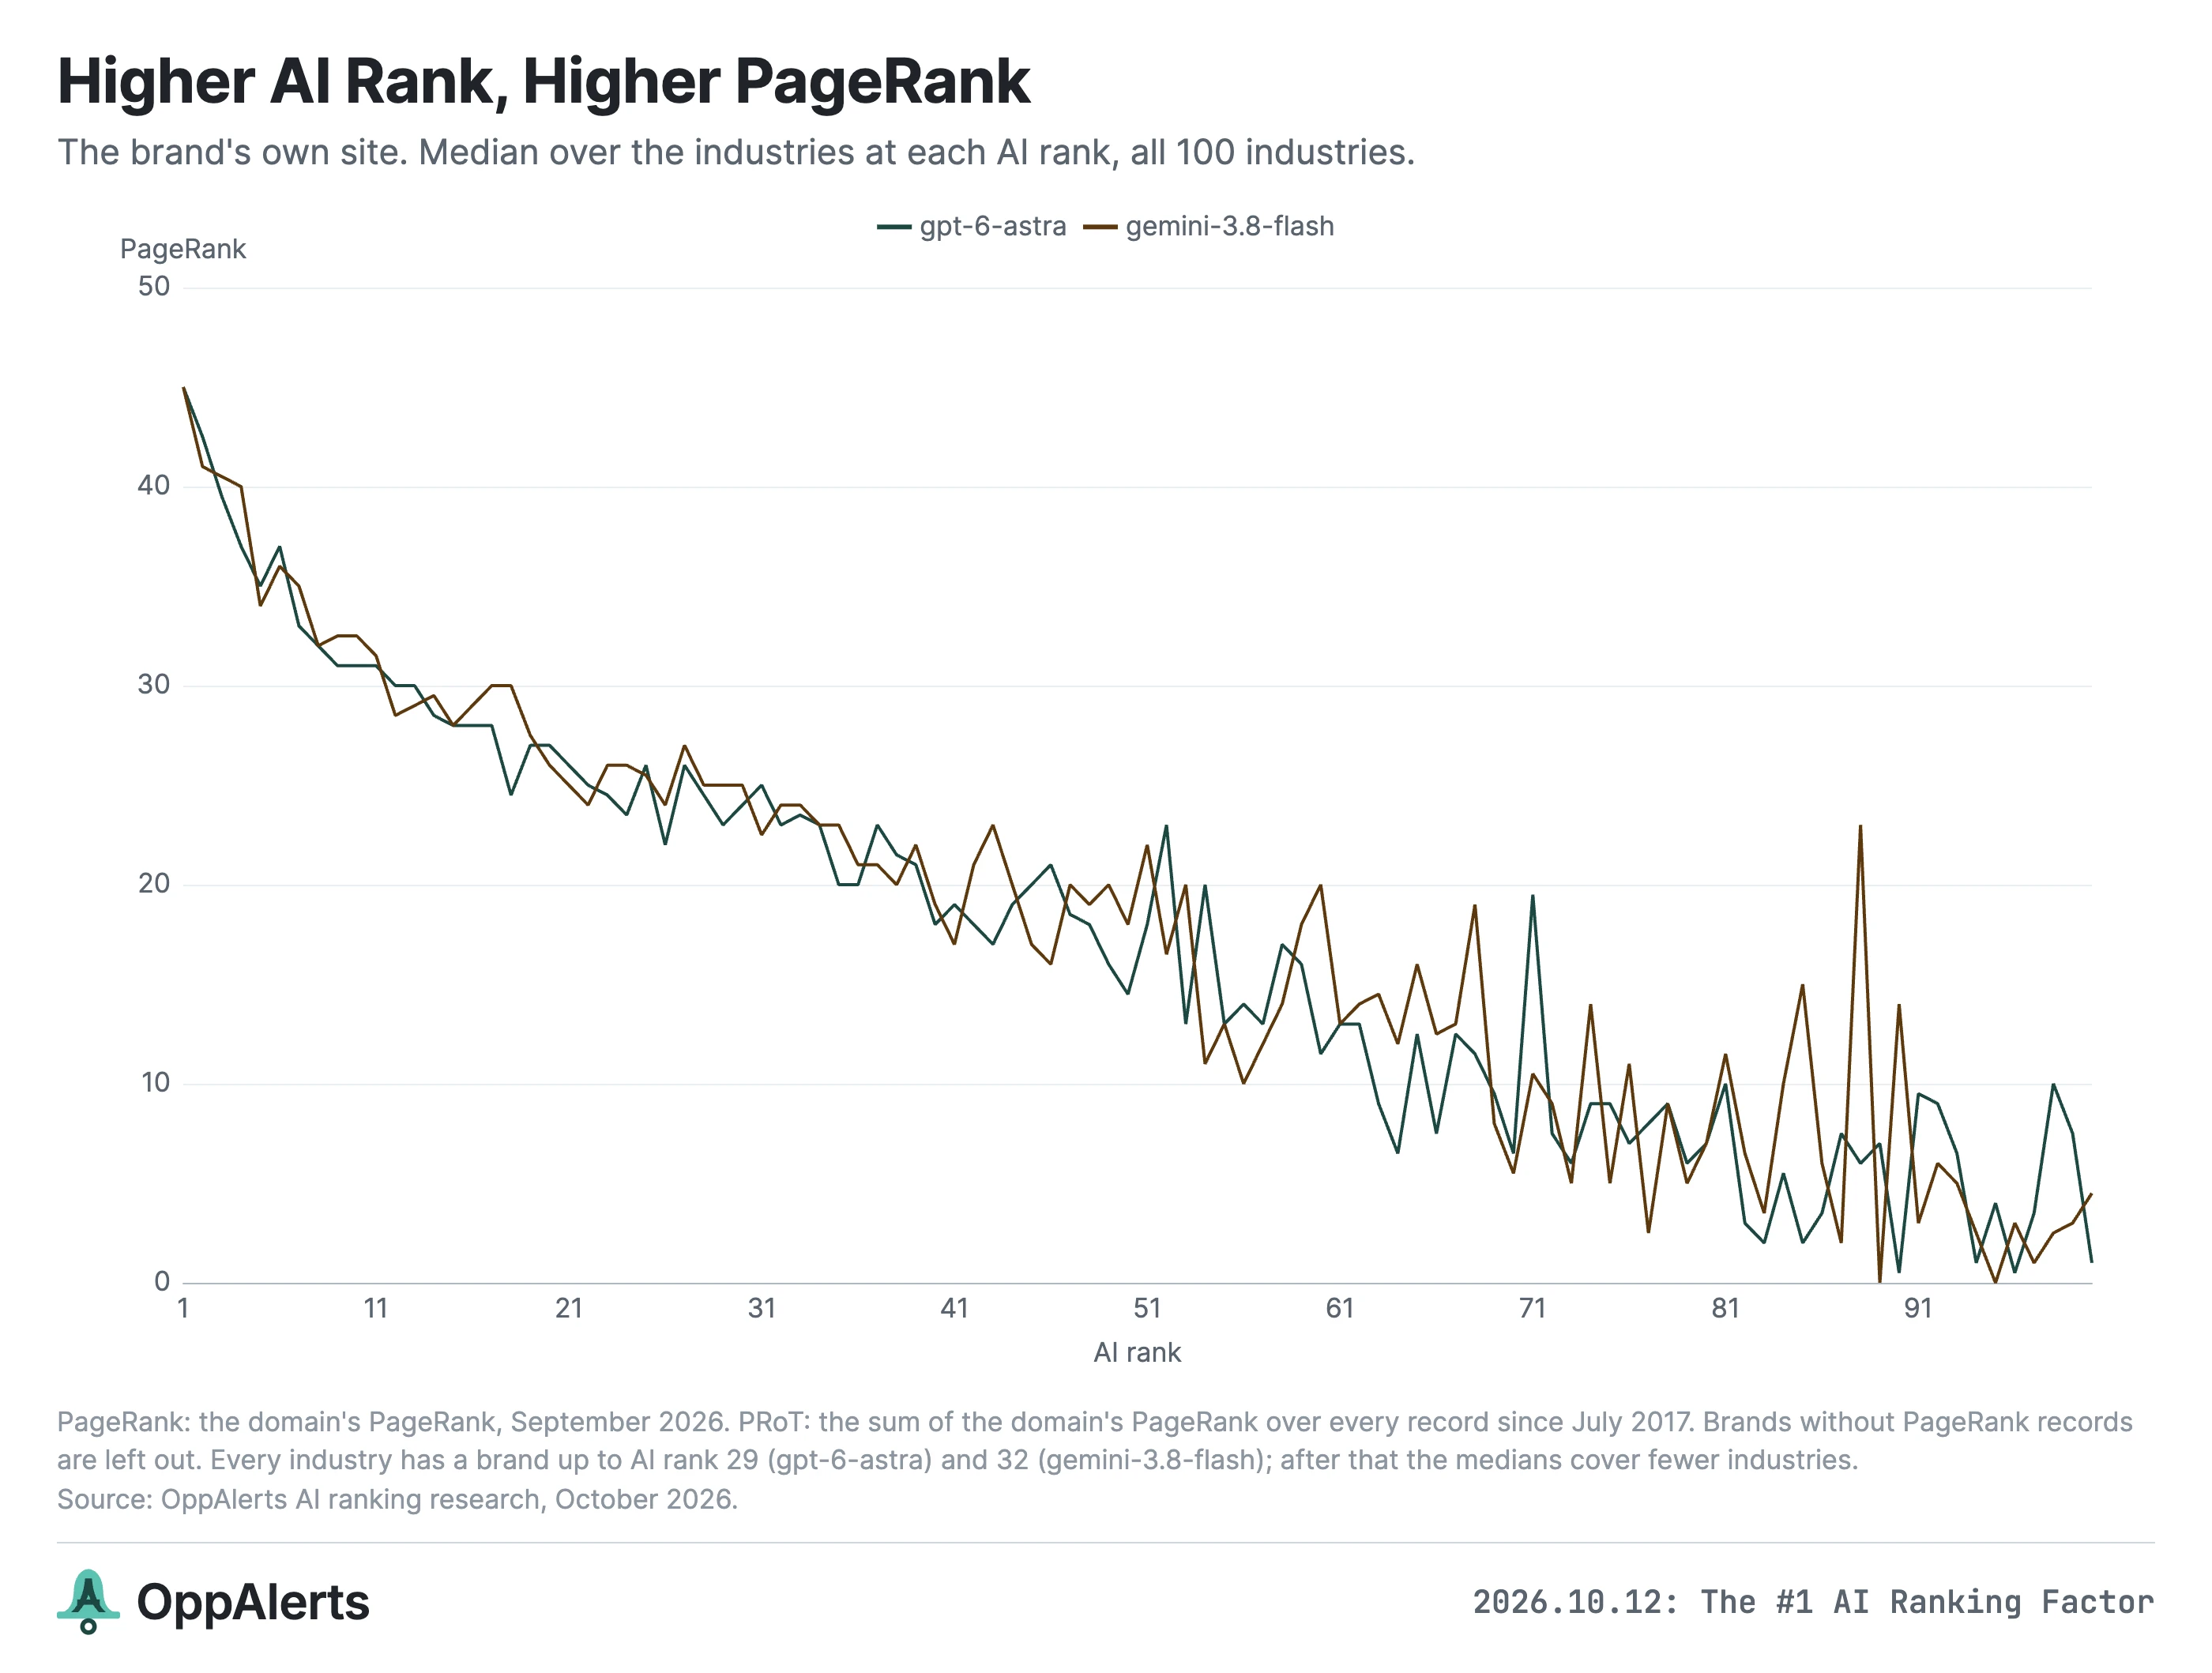
For GPT-6 Astra, the median PageRank is 45 at AI rank 1, 31 at rank 10, 26 at rank 25, and 14.5 at rank 50.
Gemini 3.8 Flash follows almost the same line.
Within industries, PageRank correlates with AI score at 0.54 for GPT-6 Astra and 0.53 for Gemini 3.8 Flash. That's about as strong as total link count.
PRoT, the PageRank accumulated over time, follows a similar pattern:
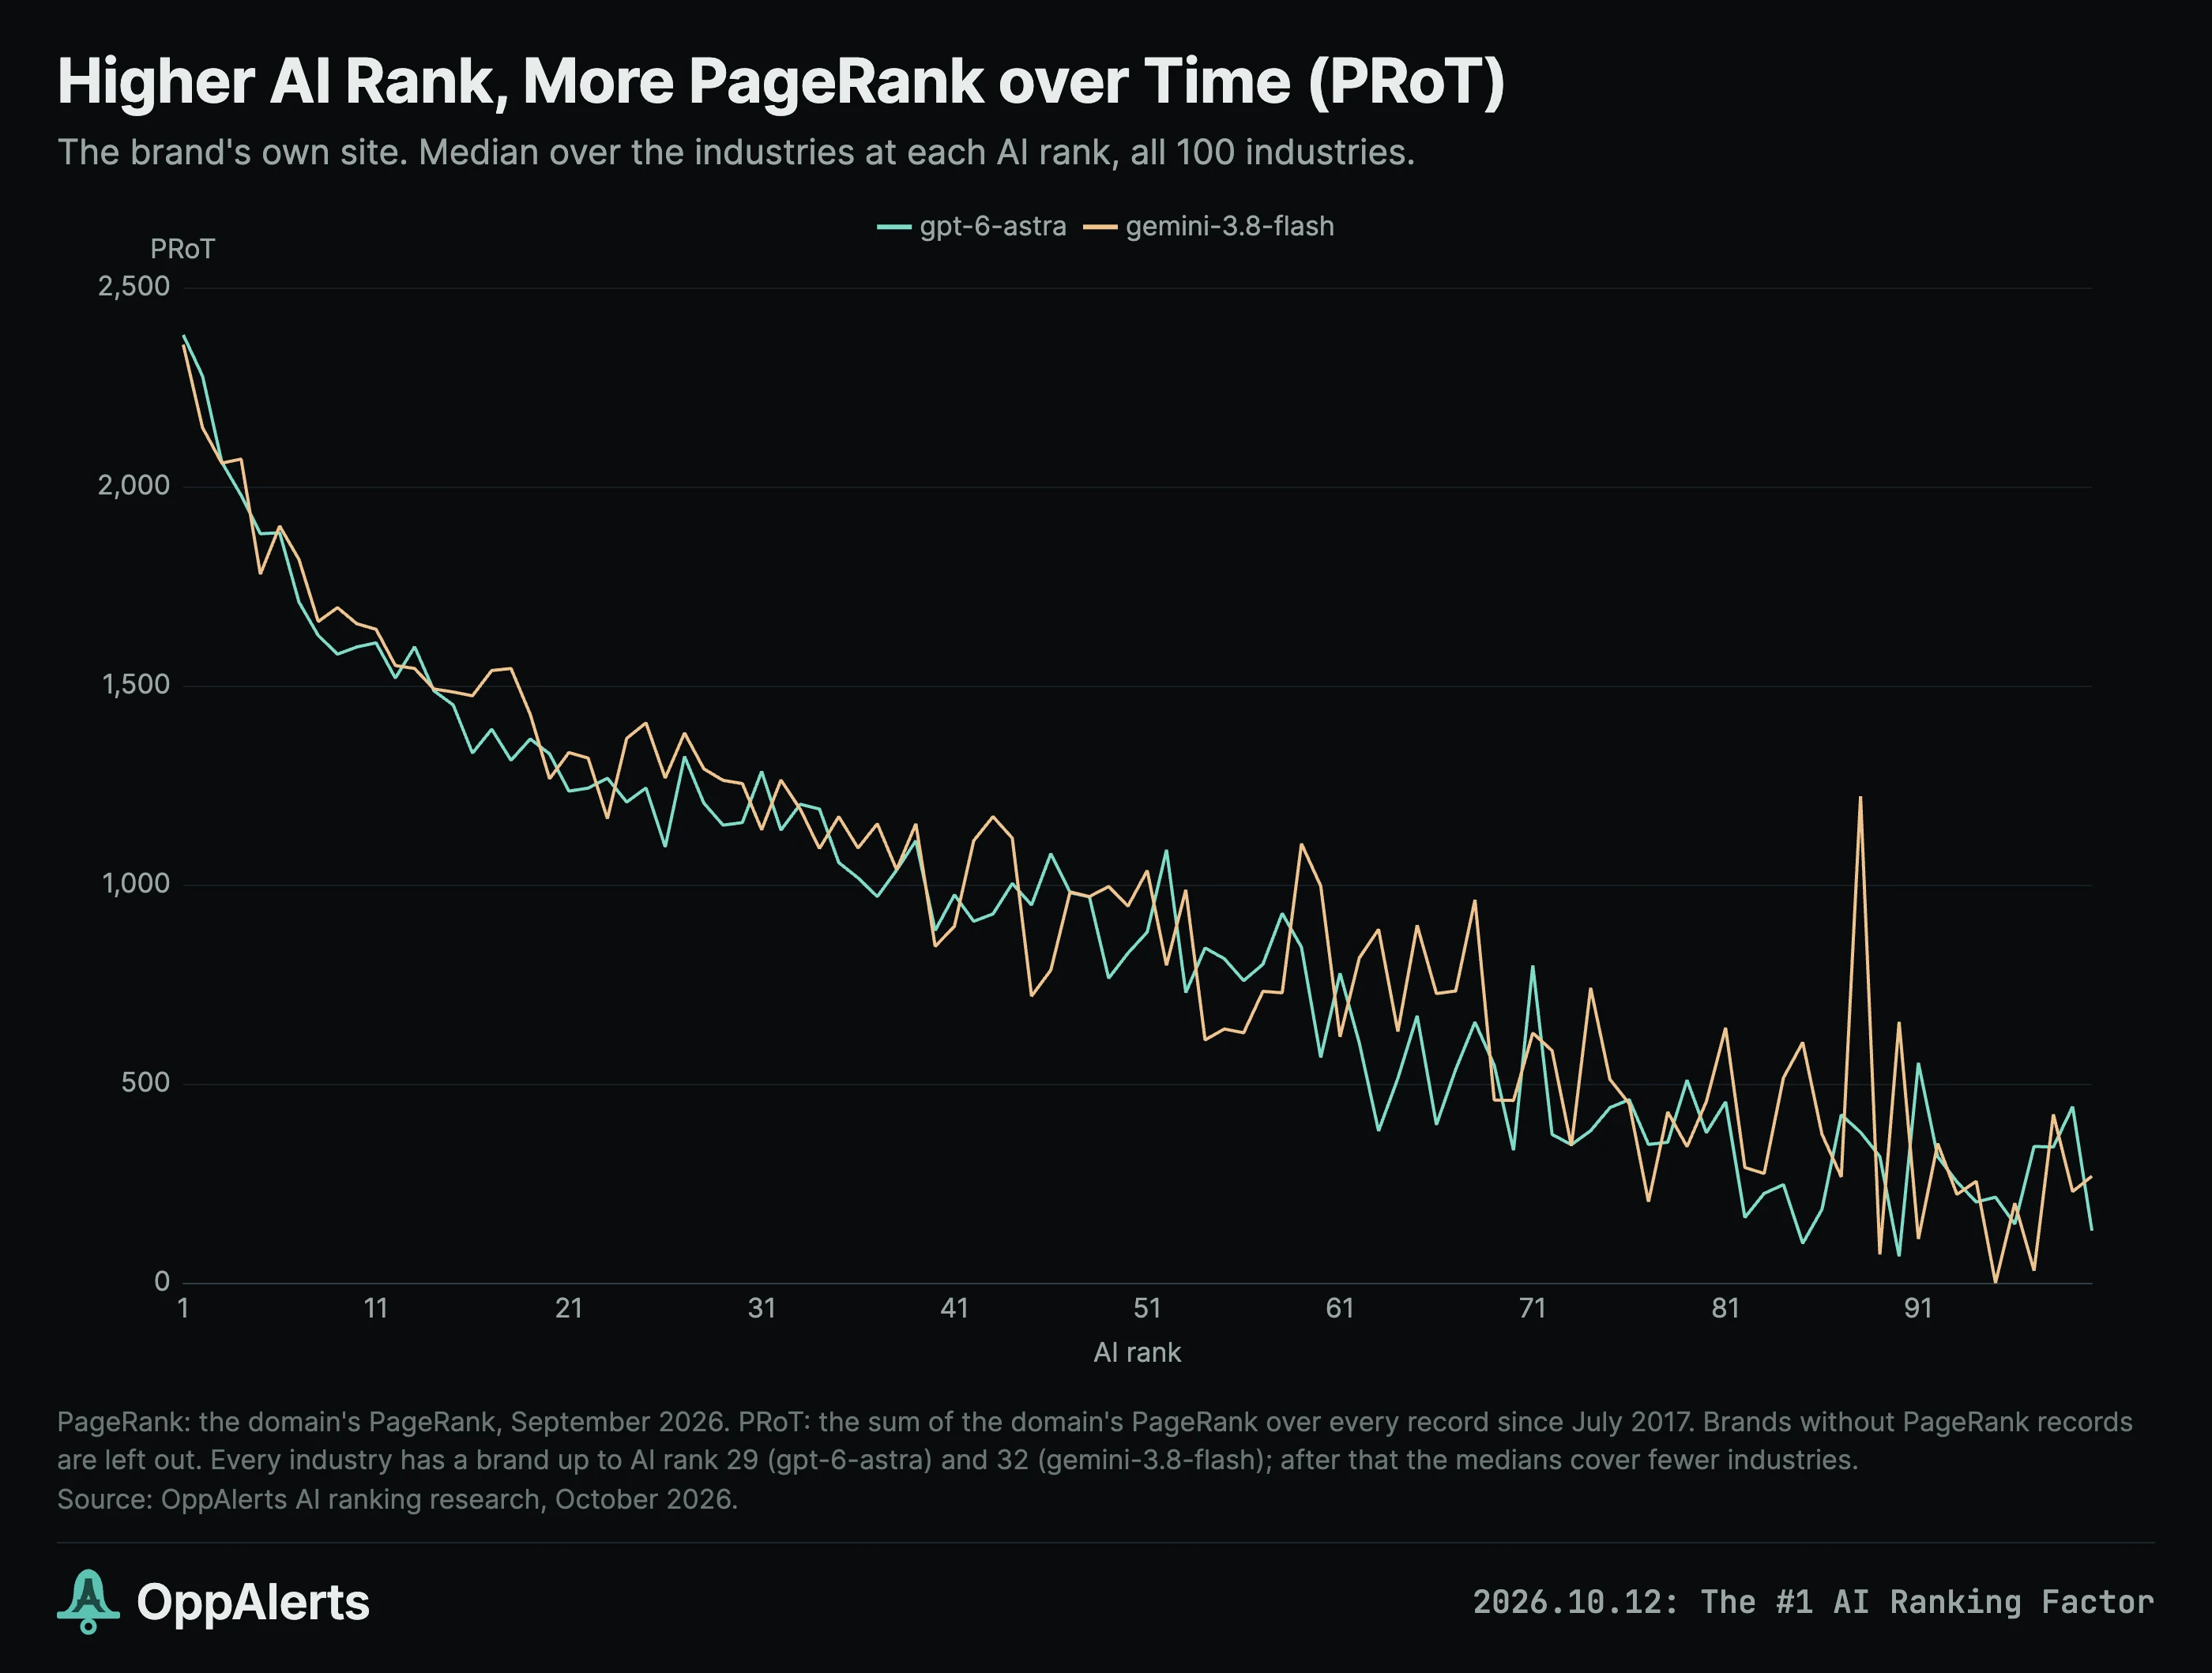
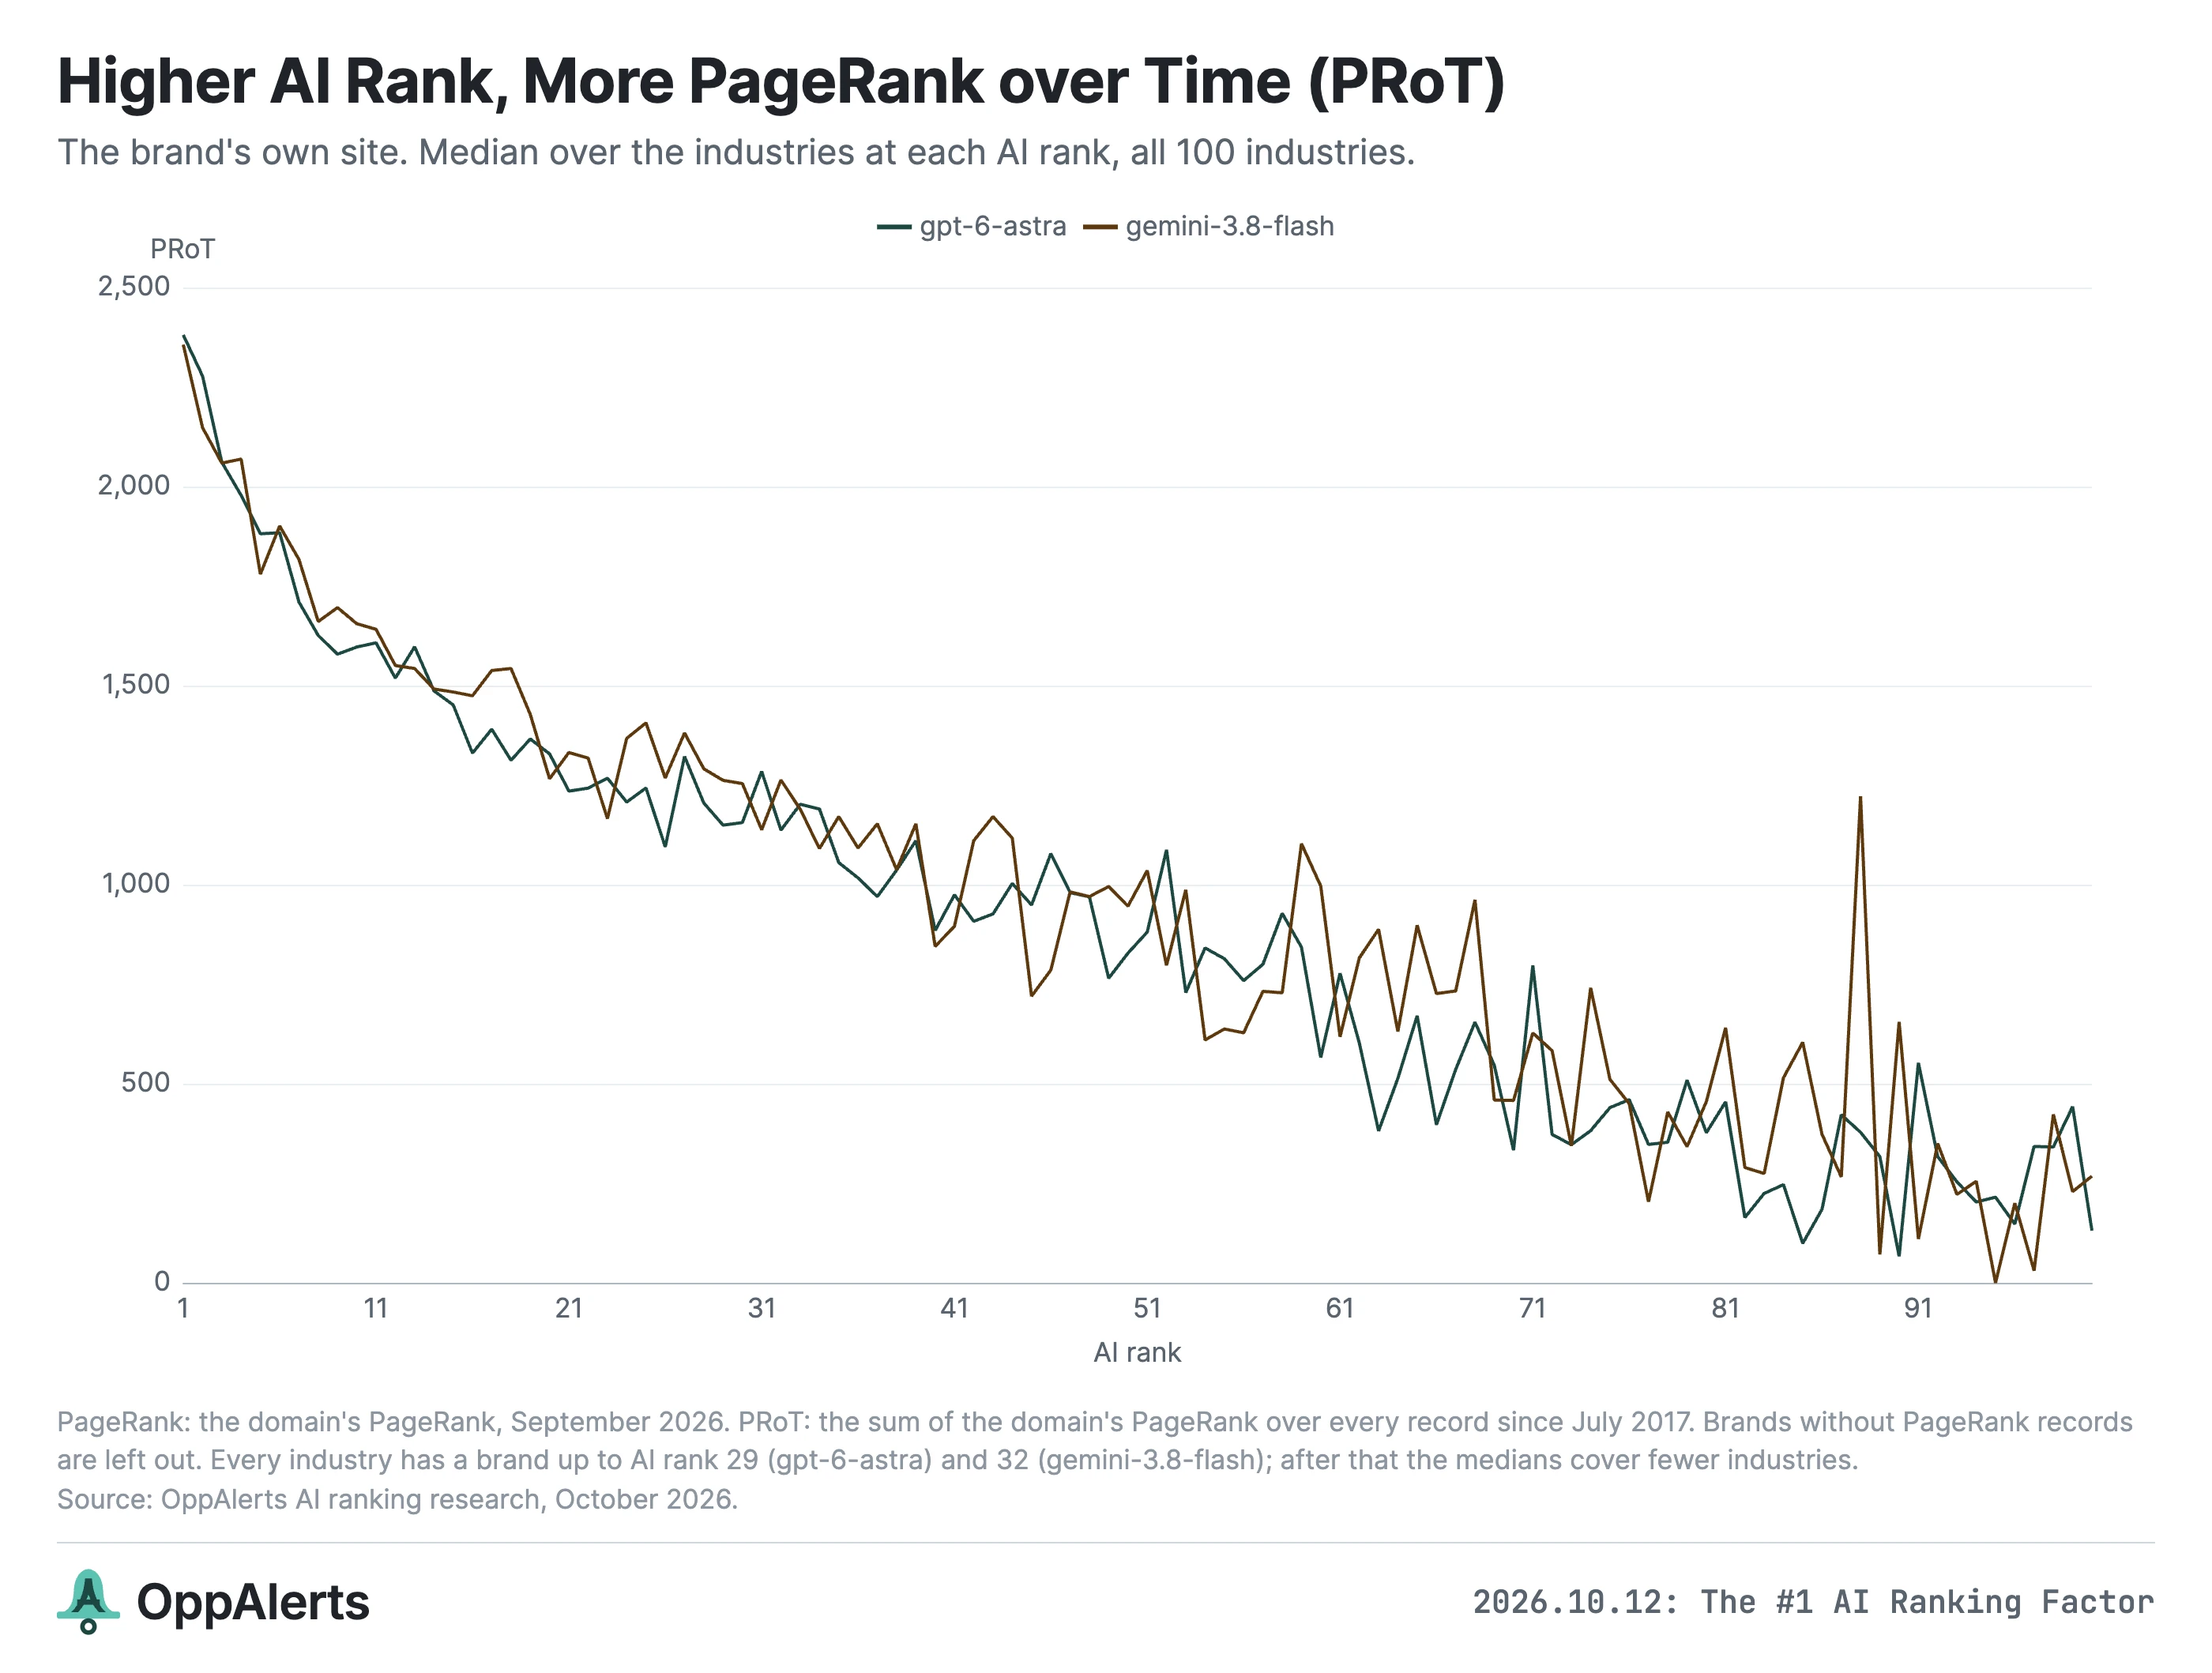
Of course, PageRank and backlinks are related. Links contribute to PageRank.13 So I also checked how much information each measure adds after accounting for the other.
For GPT-6 Astra, link count still correlates with AI score at 0.21 after accounting for PageRank. PageRank's correlation is 0.12 after accounting for link count.
Across the GPT-6 and Gemini Flash models, link count still has the stronger correlation after those adjustments. The pages in the OppAlerts indexes tell us something about AI rankings that the PageRank number alone doesn't capture.
There's another distinction here. The PageRank of the brand's own site follows its AI rank. The PageRank of the sites linking to it doesn't show the same separation.
In the PageRank database, the median PageRank of linking sites is 25.3 for GPT-6 Astra's ranks 1 to 10, and 25.2 for ranks 41 to 50. That's almost identical.
So I wouldn't reduce this to finding a few links from sites with the highest PageRank. The clearest difference here is how many pages link to the brand and how relevant those pages are.
These brands were already established nine years ago
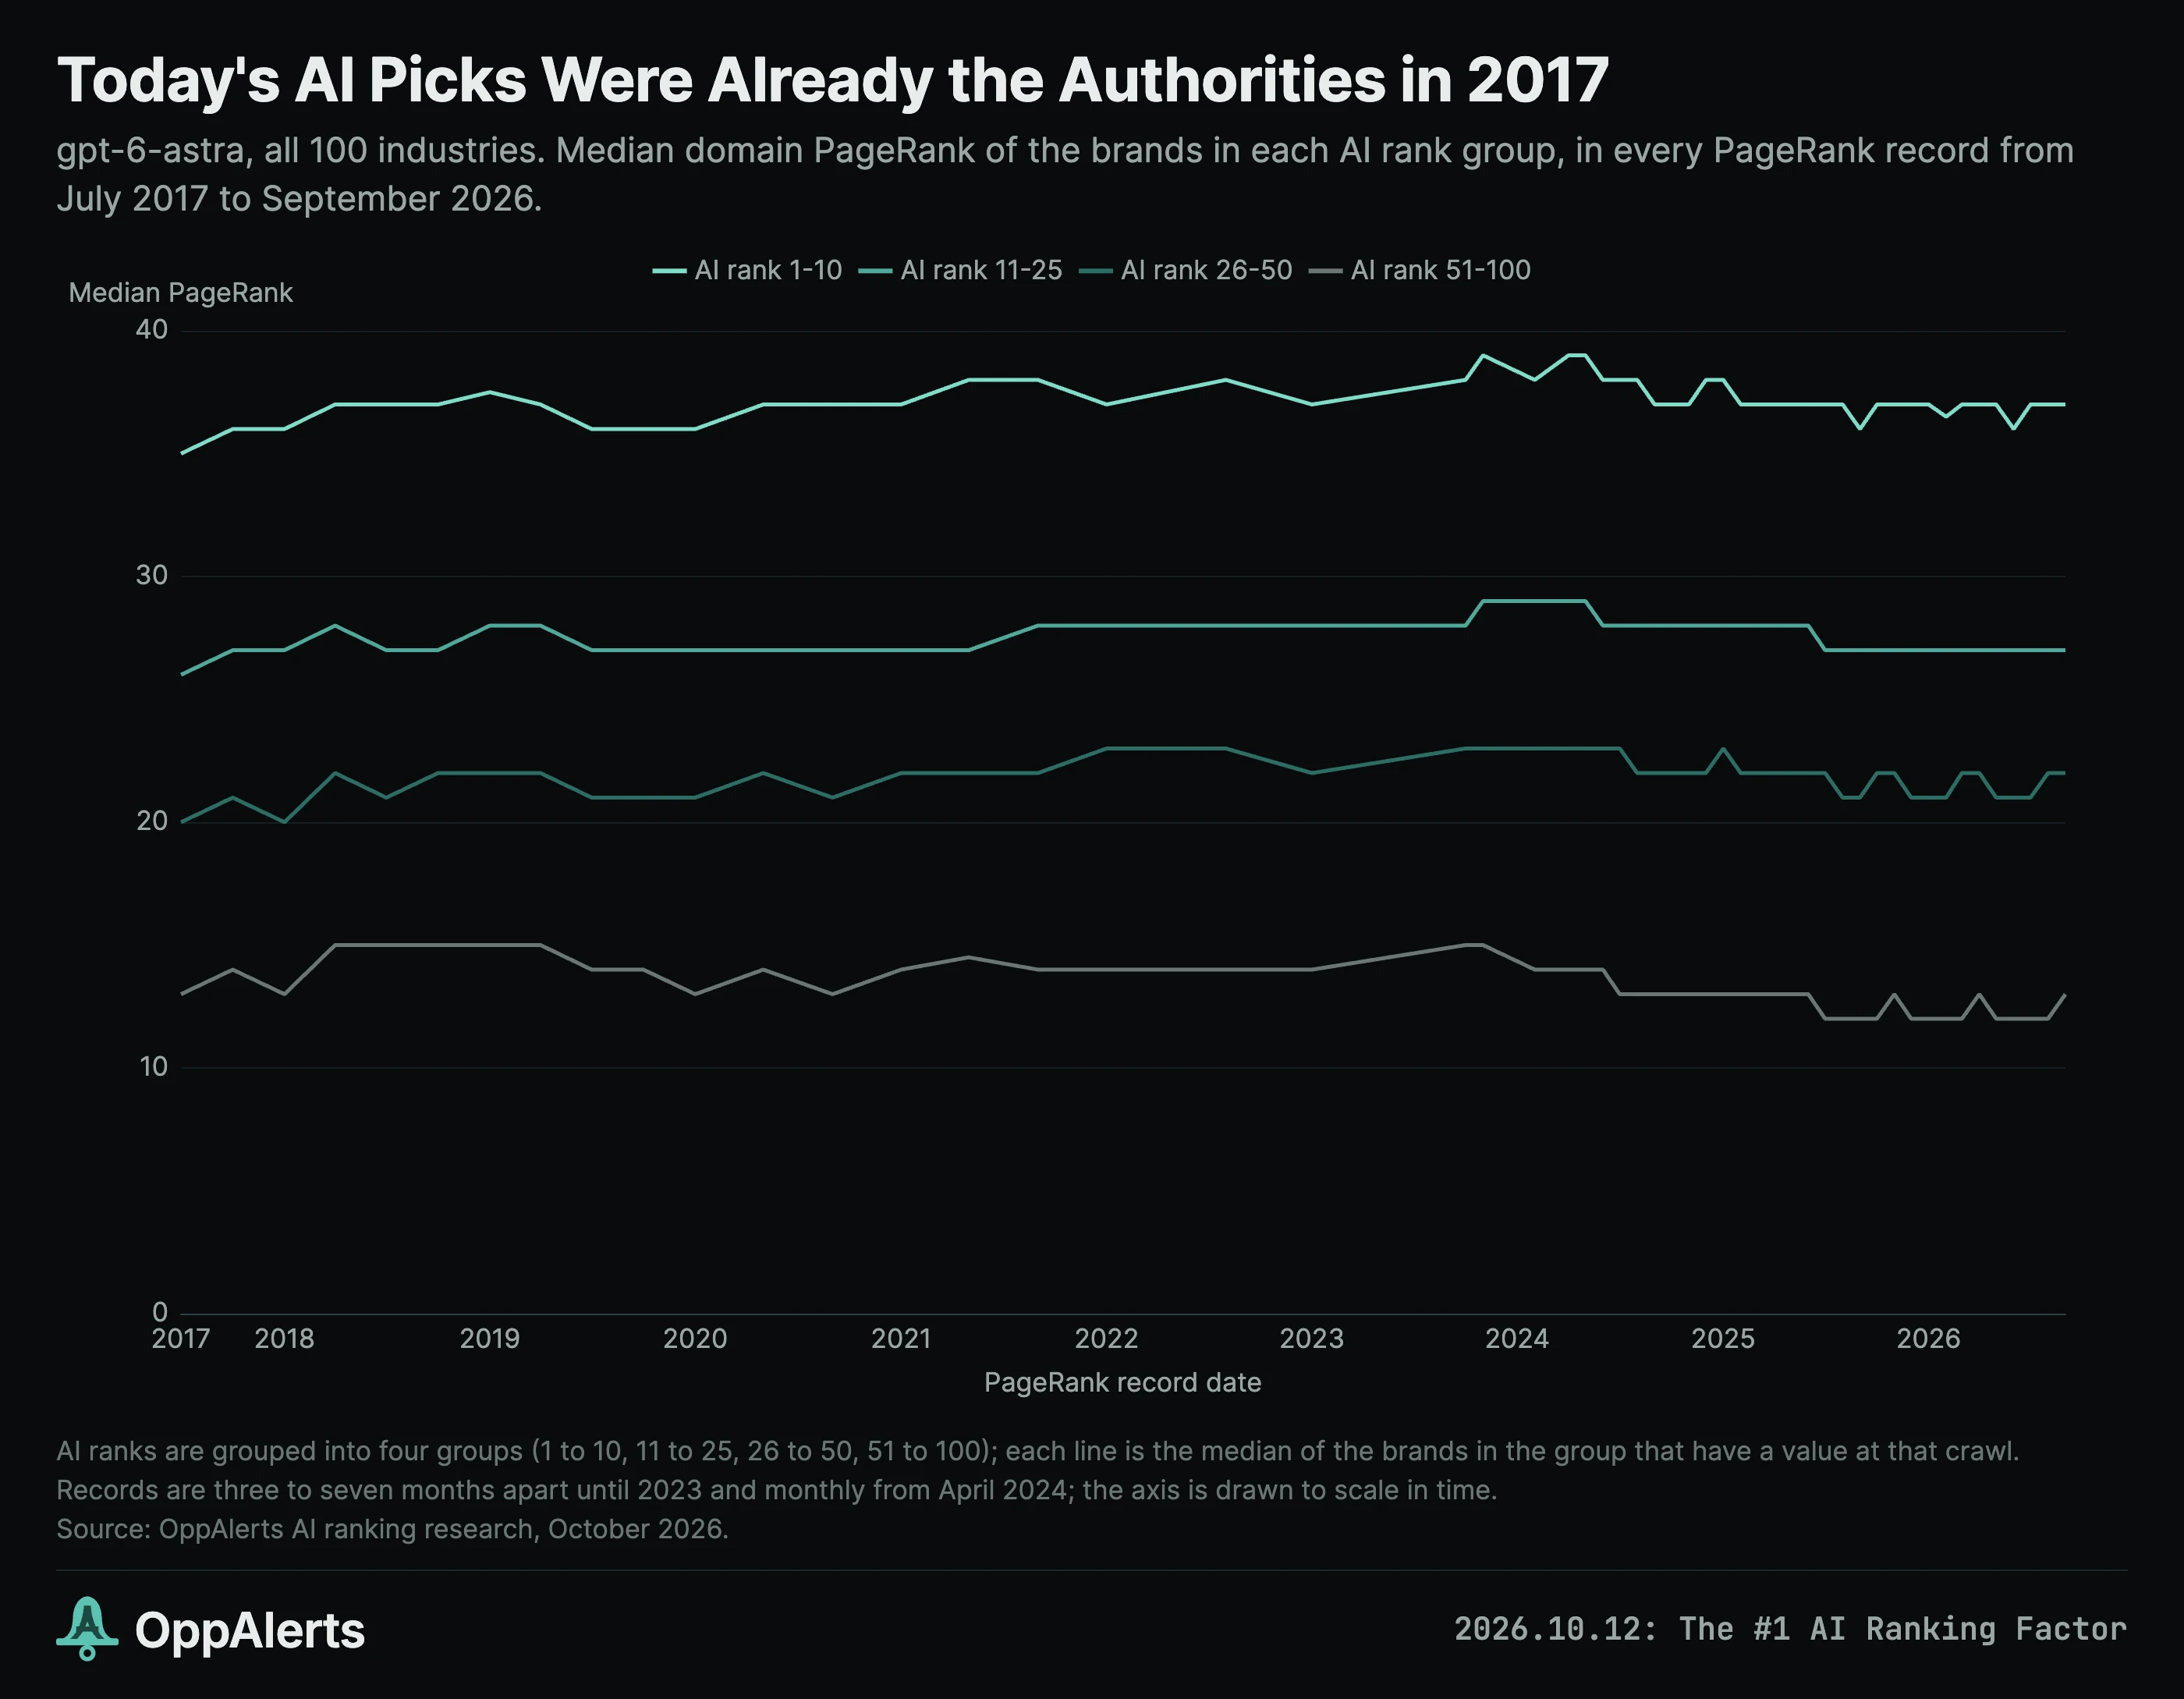
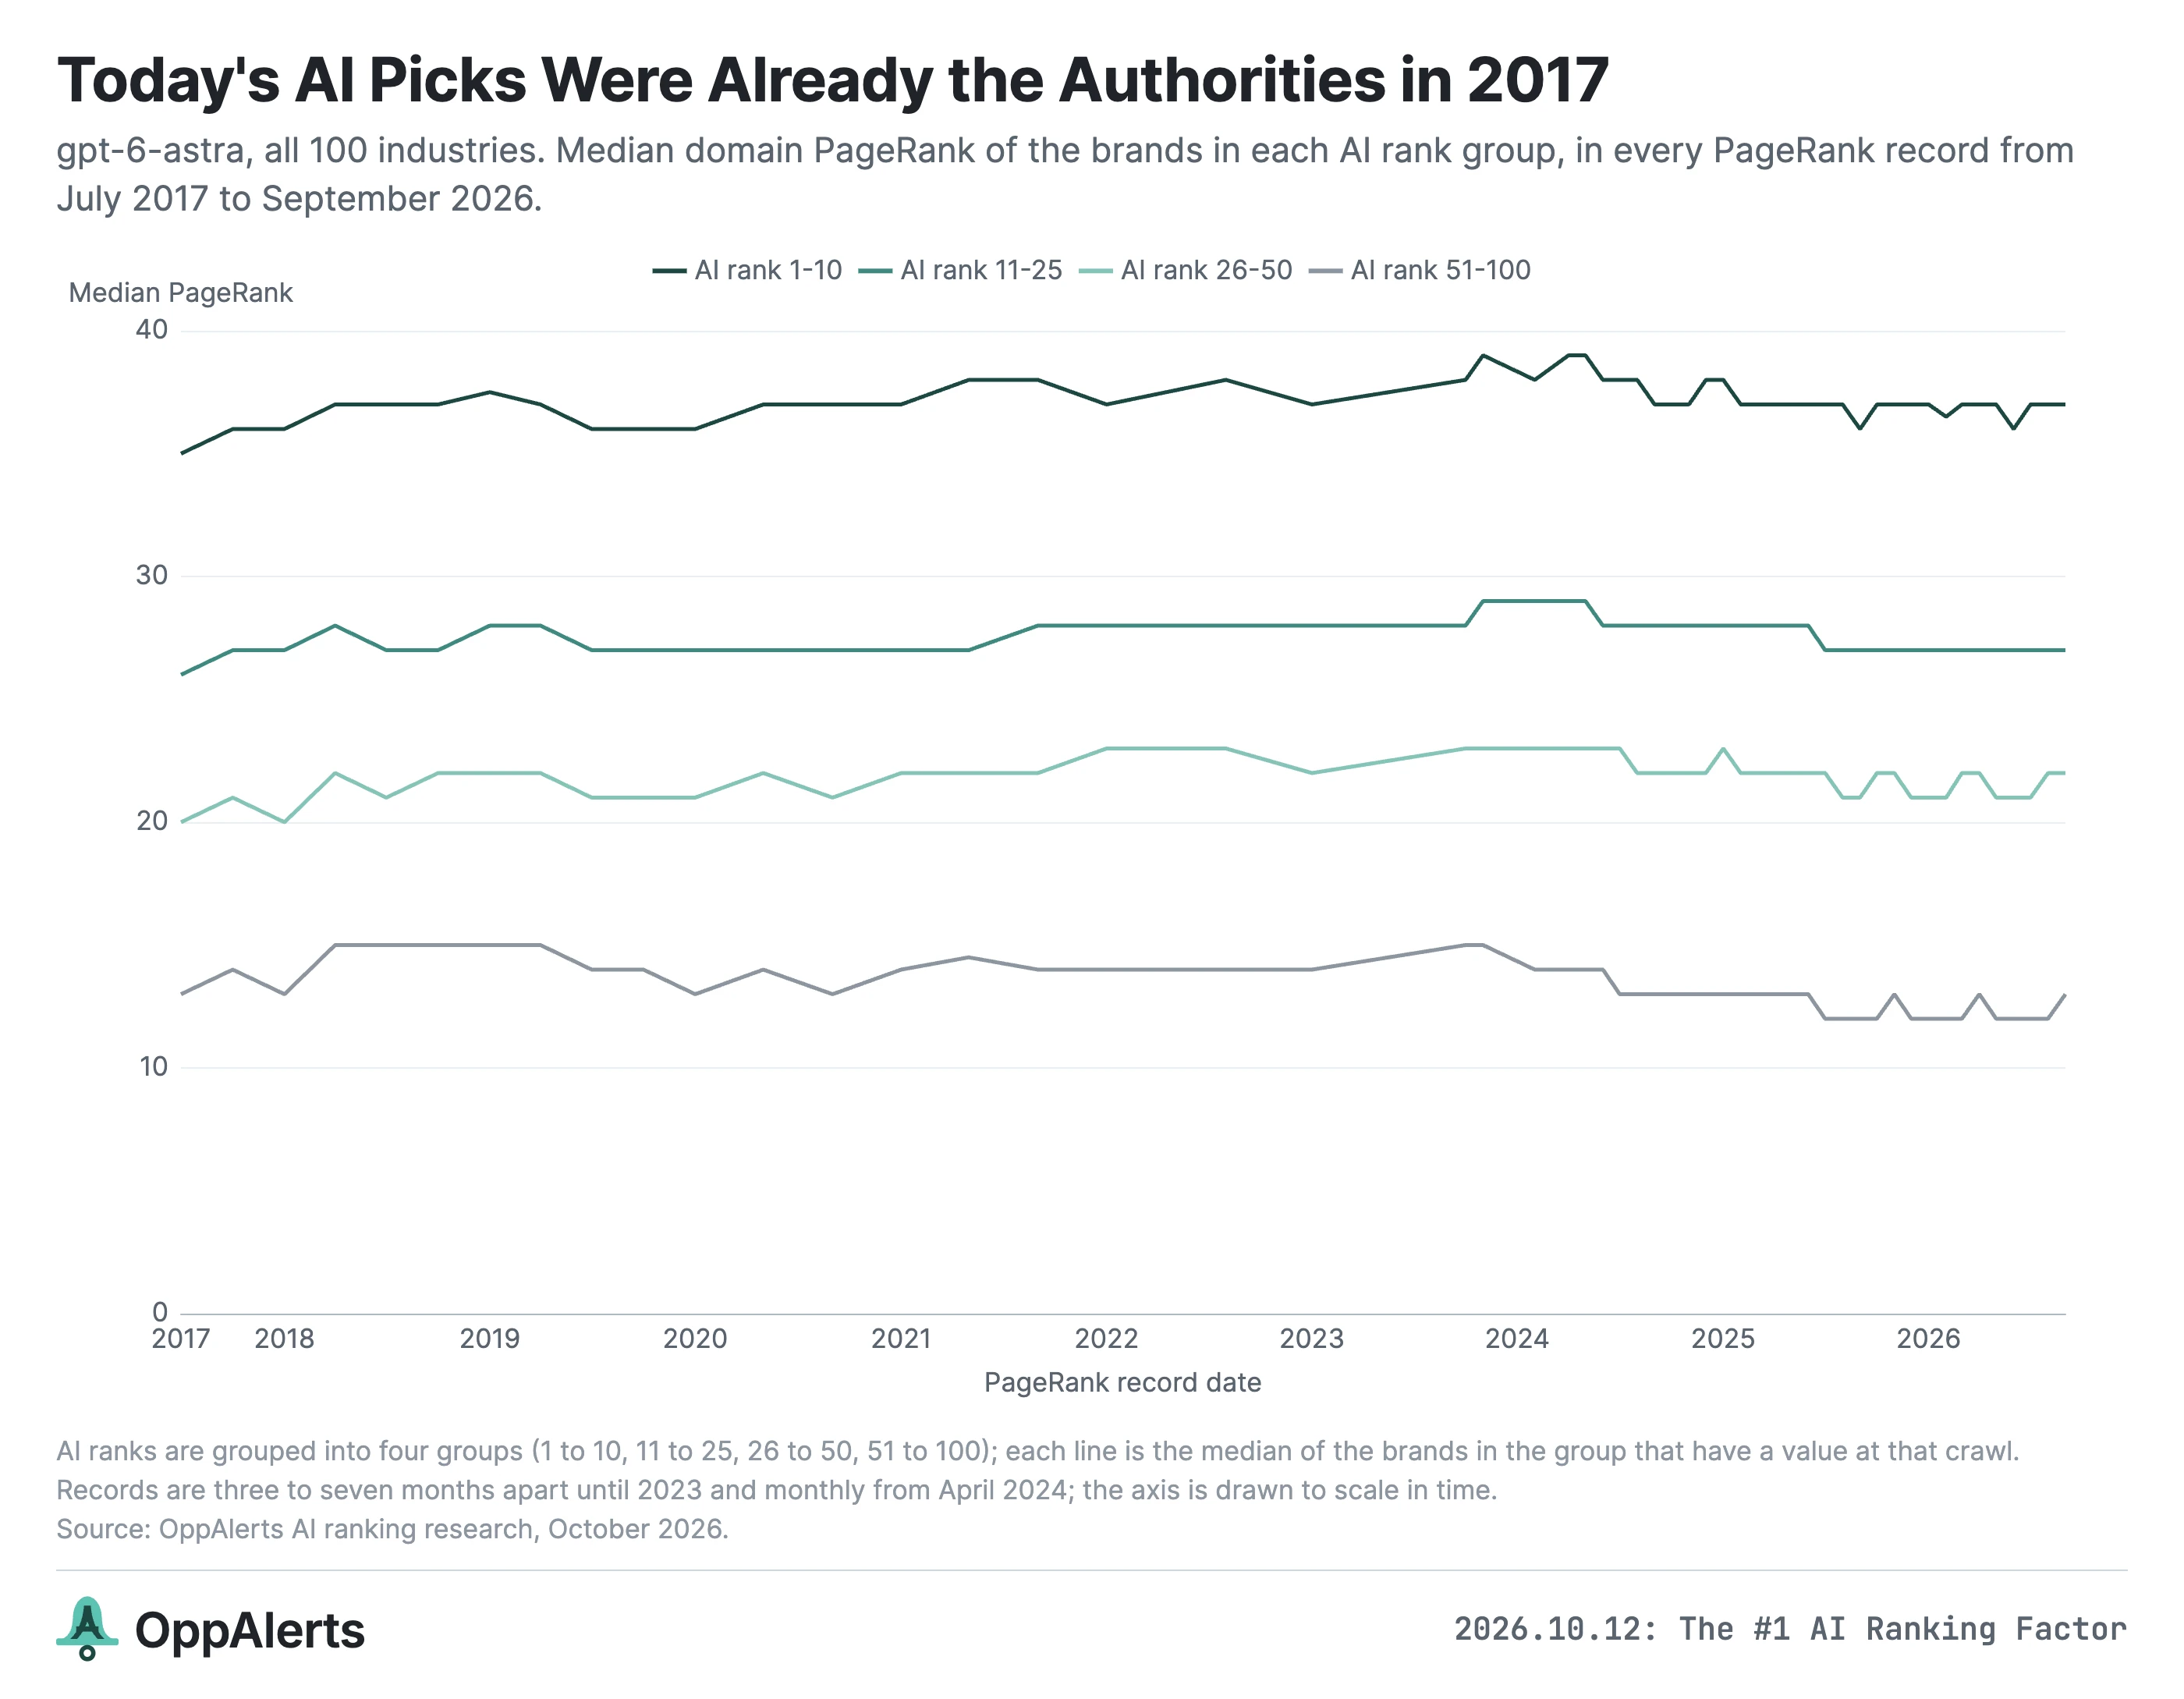
This is one of the more interesting charts in the research.
I grouped GPT-6 Astra's recommendations by their AI rank today, then looked back at their PageRank in every record since July 2017.
The groups were already in the same order nine years ago:
- Today's ranks 1 to 10 had a median PageRank of 35.
- Ranks 11 to 25 had 26.
- Ranks 26 to 50 had 20.
- Ranks 51 to 100 had 13.
By September 2026, those medians were 37, 27, 22, and 13. Each group had moved by only zero to two points.
Of the top 10 brands that have PageRank records, 94% already had PageRank in July 2017. For ranks 51 to 100, it was 80%.
This doesn't mean you can just wait for a domain to get older. How long a site has had PageRank has a correlation of 0.14 to 0.21 with AI score in GPT-6 Astra and Gemini 3.8 Flash. Once I account for current PageRank, that drops to 0.01 to 0.06.
The change in PageRank from 2017 to 2026 has very little relationship with today's AI score either, at about 0.05.
And PRoT adds only a small amount after accounting for current PageRank: a correlation of 0.07 to 0.12, about the same as the reverse comparison. For these established brands, current PageRank and PRoT tell us much of the same thing.
What I take from this is that the brands AI recommends first have been well established on the web for a long time. Their advantage didn't suddenly appear when ChatGPT launched.
That's why I would plan this as ongoing work. Build the relationships, get relevant coverage, and keep doing it.
Mentions without links follow the same relevance pattern
I also needed to test unlinked mentions separately.
If I only searched for brand names, many of the pages would also have backlinks. We wouldn't know how much of the result came from the pages with links.
So I excluded those and looked at pages that mention the brand without linking to it.
The same relevance pattern is there. All 7,200 unlinked-mention curves passed the quarter test across the 18 channels.
For GPT-6 Astra, the median brand at rank 1 has 7,176 unlinked mentions, almost twice its backlink count.
When we compare the counts with AI rankings, though, links have the stronger relationship:
- GPT-6 Astra: 0.55 for backlinks, 0.41 for unlinked mentions.
- Gemini 3.8 Flash: 0.54 for backlinks, 0.39 for unlinked mentions.
- ChatGPT web: 0.45 for backlinks, 0.31 for unlinked mentions.
After accounting for unlinked mentions, links still correlate at 0.25 to 0.40. After accounting for links, unlinked mentions correlate at 0.09 to 0.14.
So the mentions add information, but the link counts have the stronger relationship in these comparisons.
There's one exception: the brands named in Google's AI Overviews. There, unlinked mentions correlate at 0.37, compared with 0.33 for links. It's the only list in this research where the mention count comes out ahead.
Measuring mentions gets messy. A brand name can also be an ordinary phrase. “Four Seasons” can refer to hotels, Vivaldi, or an athlete's last four seasons.
For fourseasons.com, the data has 3,284 backlinks but only 94 unlinked mentions. I wouldn't treat that mention count as a complete picture of how often people talk about the hotels.
This is one reason semantic context matters so much for brand monitoring.
For your campaigns, I would look for relevant mentions and build relationships with the people publishing them.14 When a page already mentions your brand, asking for a link is a straightforward place to start. The data gives us a reason to pursue both.
Where unlinked mentions are even more focused than links
In the video, I said the correlation for pure mentions can look even stronger than for links. What I meant was the slope of the curve. For some industries, more of the unlinked mentions were on pages about the industry's own categories, and fewer were about unrelated ones, so the curve dropped more sharply.
On average, that's not the case. Links usually have the steeper curve. In Google Ads Topics, the unlinked mentions are steeper in only about 1 in 10 combinations of model and industry.
But in some industries it happens again and again. I checked 24 curves per industry: six GPT-6 and Gemini Flash models across the four taxonomies. In these four industries, the unlinked mention curve was steeper in all 24:
- Streaming video services
- Live entertainment and ticketing
- Residential real estate brokerages
- Affiliate-marketing networks
Several B2B software industries come close, including CRM, cloud infrastructure, healthcare IT, and customer support software (17 to 18 of 24). Scientific instruments is at 20 of 24.
Hotels, vacation rentals, and online travel agencies show it in Google Ads Topics, the taxonomy behind the charts in the video, in all six models. In the other taxonomies, the links are mostly steeper for those industries.
At the other end are the clinics. For cosmetic surgery, cosmetic dentistry, and med spas, the link curve is steeper in 23 or 24 of the 24 curves.
Why would mentions be more focused in some industries?
My guess was brand recognition. If people know the brands in an industry, they name them when they write about that industry, whether they link or not.
I can't measure brand recognition directly, but I can measure things that go with it. Across the 100 industries, the unlinked mention curve is relatively steeper where:
- The top 10 brands have a higher PageRank (correlation of 0.59).
- The top 10 brands have more relevant backlinks (0.57).
- The top 10 brands are named on more pages without a link (0.38).
- The AI models agree more on the top 10 (0.32).
And it's relatively flatter where the AI models hallucinate more domains (-0.40).
So the industries where the leading brands are established names are the ones where pure mentions are most on topic. This shows up in business markets too. 10 of the 13 industries where mentions have the steeper curve on average are B2B.
For your campaigns: if your industry has well-known leading brands, mentions of your brand on pages about the industry carry the same relevance signal as links, sometimes a stronger one. If your industry is made of smaller or local businesses, the links carry the clearer signal.
How much is a mention worth compared with a link?
There are two ways to put a number on it.
When we look at relevance, mentions are nearly as focused as links. Across the six GPT-6 and Gemini Flash models, the unlinked mention curve is about 90% as steep as the link curve on average (90% in Google Ads Topics, up to 95% in NAICS).
When we compare AI scores, a link carries much more weight. I compared each brand's position in its industry with its backlinks and its unlinked mentions at the same time. For a typical brand, with about 200 backlinks and about 450 unlinked mentions, one more backlink lines up with about as much AI score as 10 more unlinked mentions. Across the six models, that ranges from 6 (GPT-6 Luna) to 15 (Gemini 3.7 Flash). ChatGPT web is at about 10. Counting only the relevant pages gives almost the same result.
Google's AI Overviews are the exception. For the brands named there, one backlink lines up with about 1.4 unlinked mentions.
So the content around unlinked mentions is almost as relevant as the content around links. But in the ranking comparison, one backlink lines up with about as much AI score as ten unlinked mentions.
Why some of the charts get spiky
As you move down the rankings in the 3D charts, you'll see some very tall bars in categories that seem unrelated to the industry.
A lot of that comes down to how many pages we're averaging.
If a brand has 5,000 backlinks, one unusual page barely changes its profile. If it has three backlinks, that one page makes up a third of the profile.
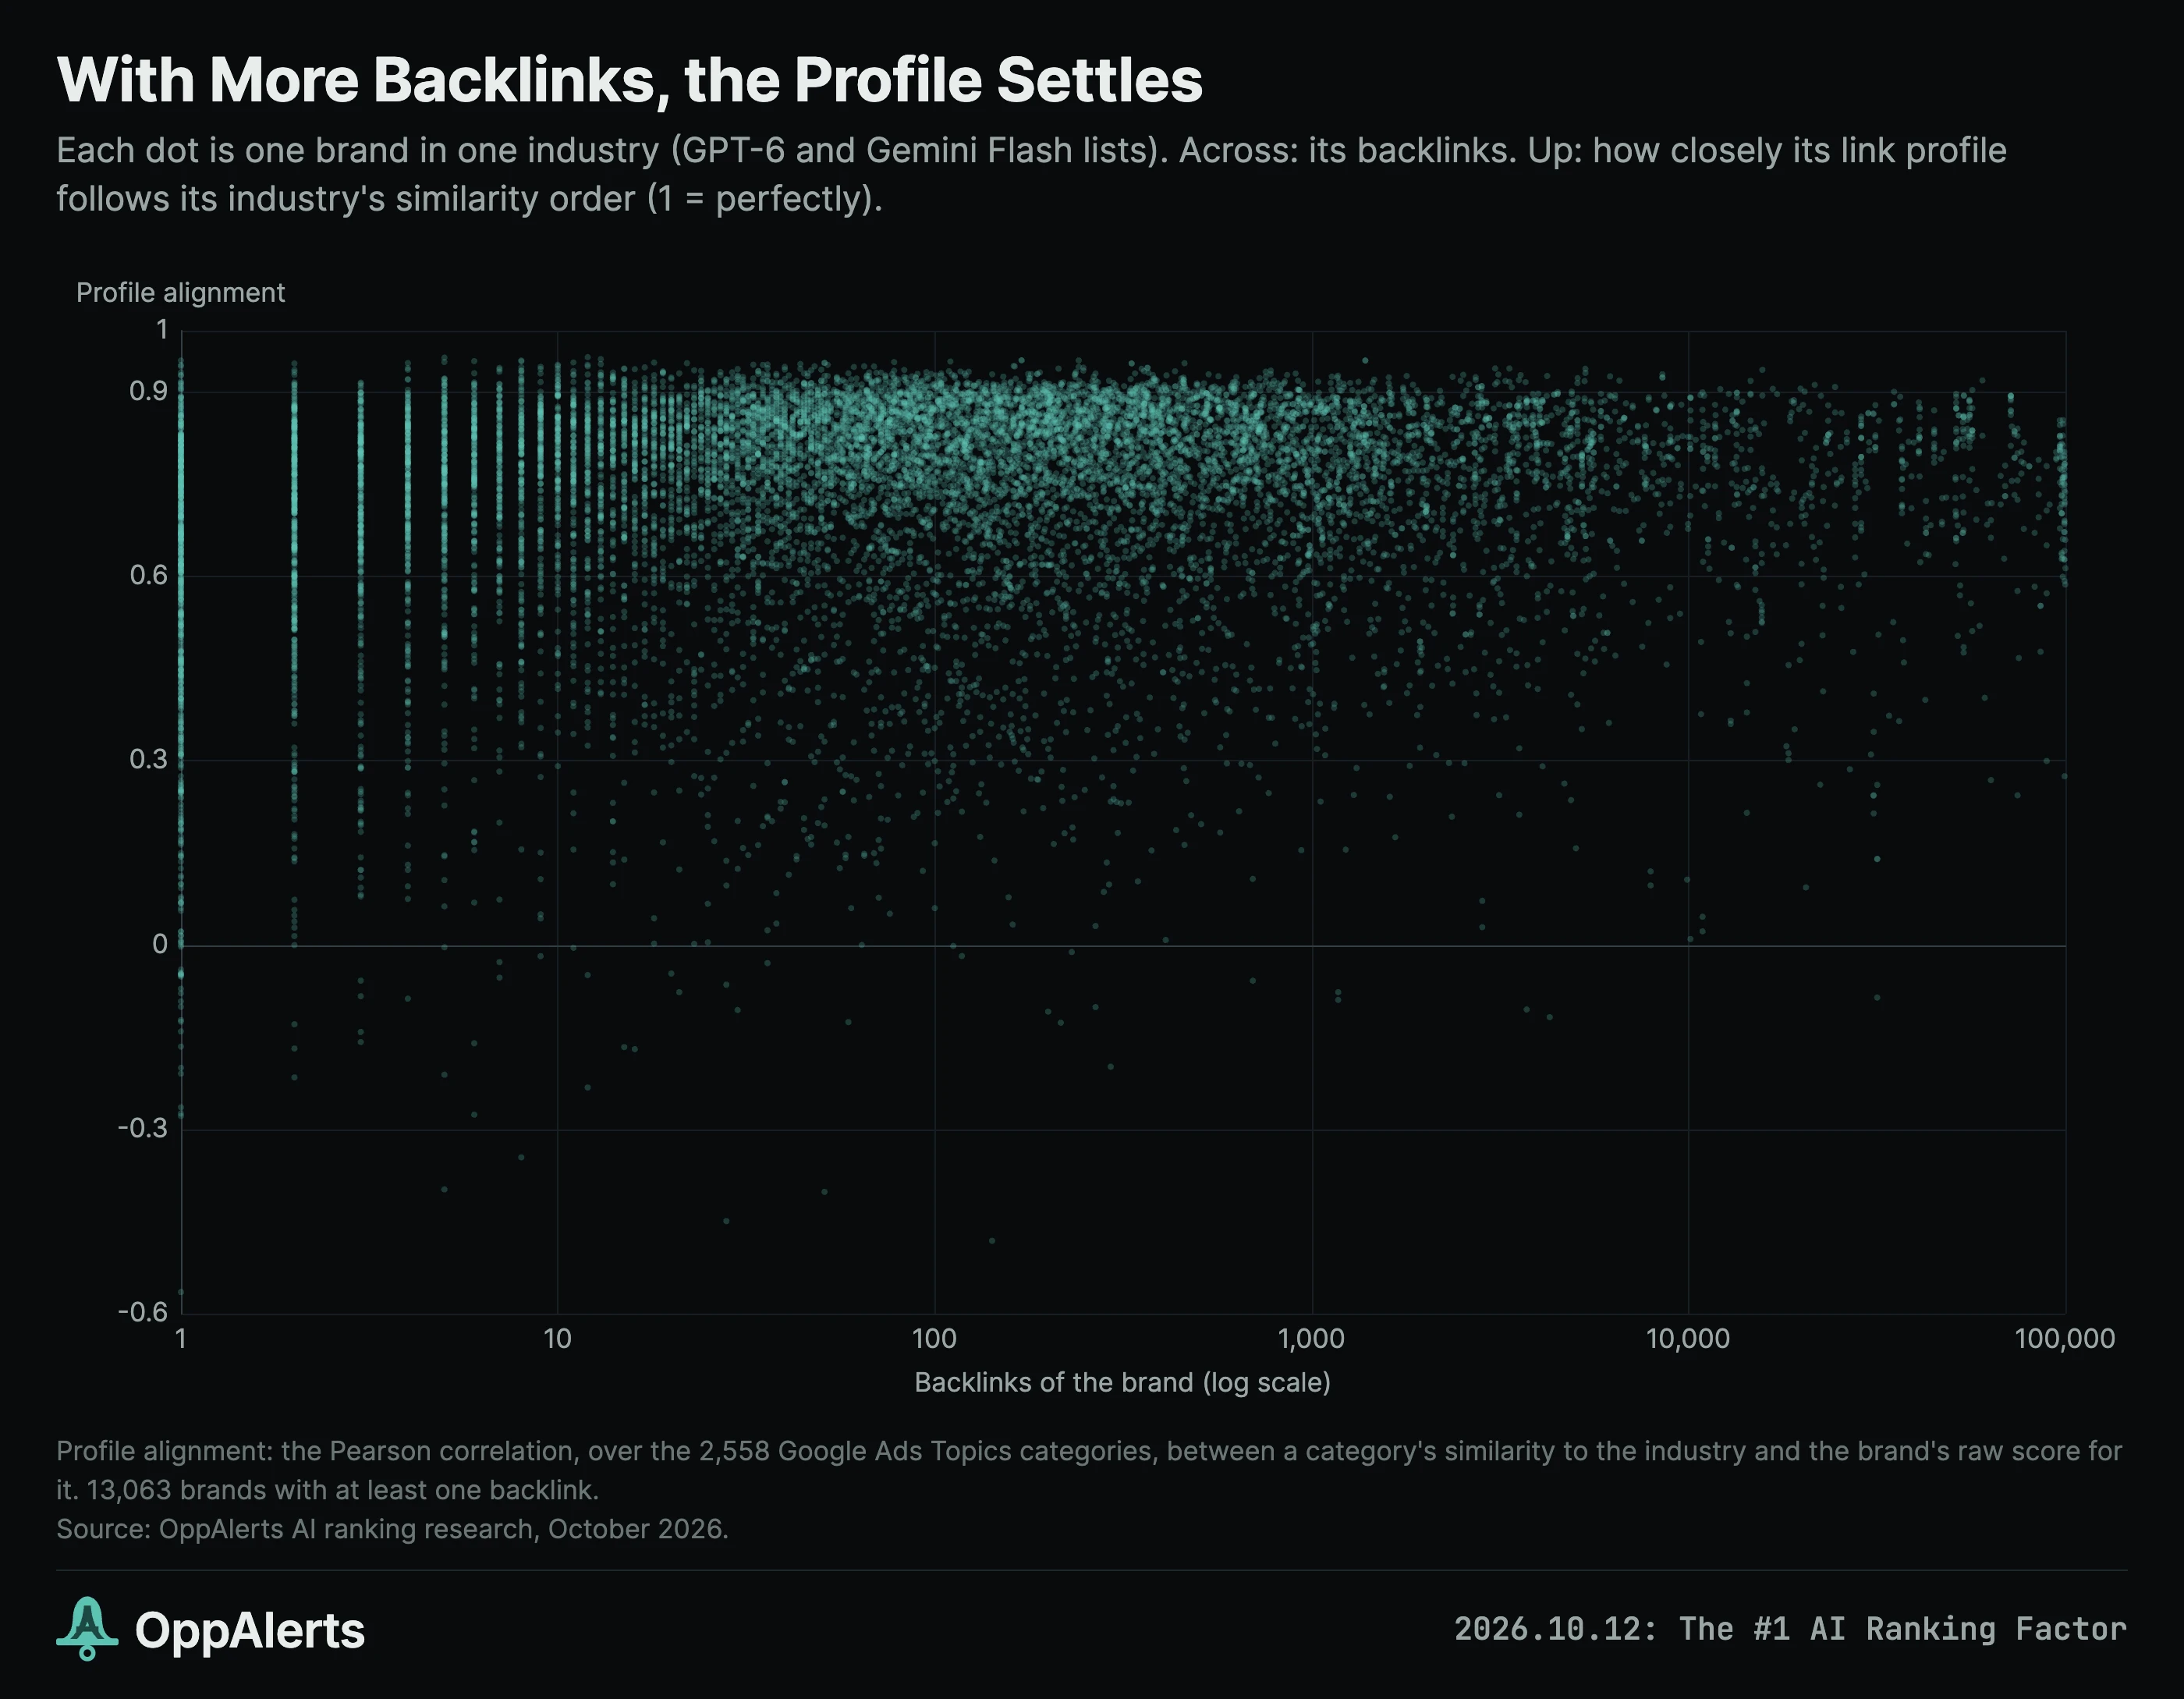
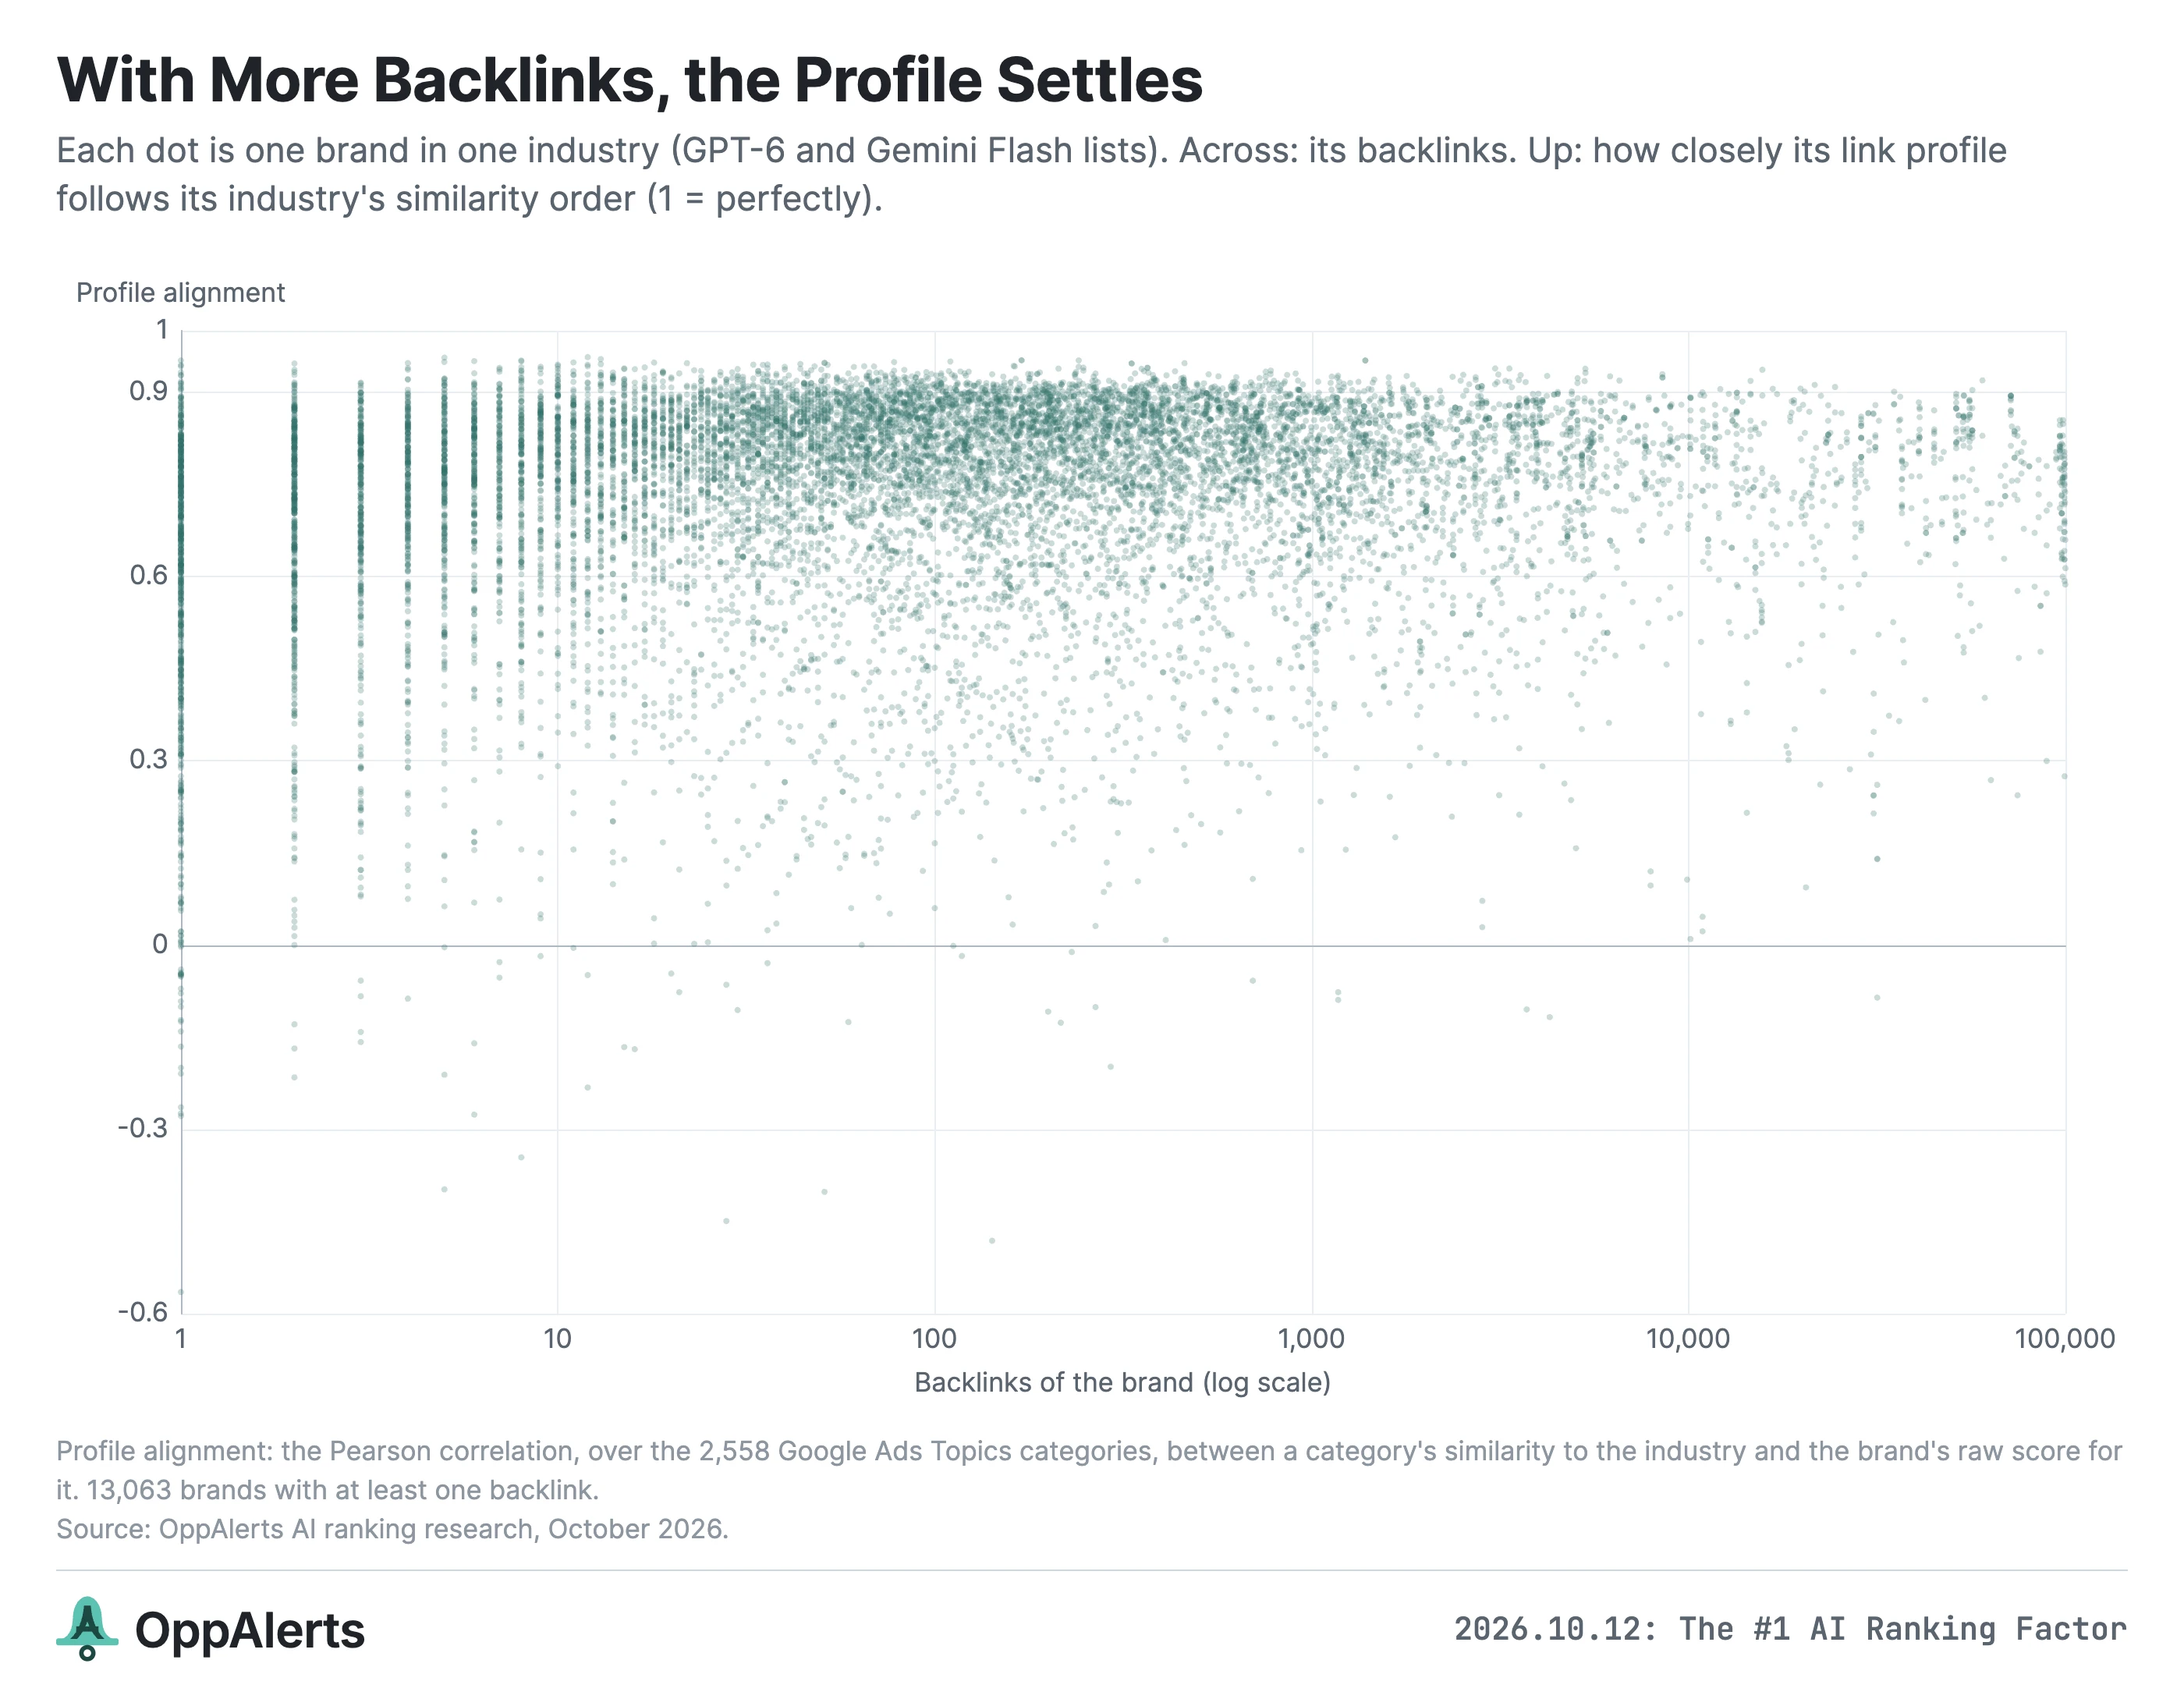
To measure this, I calculated a profile alignment score. It compares the order of the industry's categories with the scores of the brand's backlink profile. A score close to 1 means the profile closely follows the industry's category order.
Each dot here is one brand:
| Backlinks of the brand | Brands | Median alignment | 10th percentile | Own category in the brand's top 1% |
|---|---|---|---|---|
| 1 | 595 | 0.63 | 0.20 | 60% |
| 2 to 5 | 1,202 | 0.73 | 0.39 | 76% |
| 6 to 20 | 1,859 | 0.78 | 0.51 | 85% |
| 21 to 100 | 3,173 | 0.81 | 0.55 | 88% |
| 101 to 1,000 | 4,047 | 0.81 | 0.57 | 81% |
| 1,001 to 10,000 | 1,594 | 0.79 | 0.55 | 64% |
| over 10,000 | 593 | 0.77 | 0.54 | 38% |
This includes brands from the GPT-6 and Gemini Flash lists, counting each combination of brand and industry once.
With only one backlink, the alignment can be below 0.2 or above 0.8. From around 20 pages onward, it settles around 0.8.
That explains much of the noise at the bottom of the charts. Remember that GPT-6 Astra's median at rank 100 is only one backlink, across the eight industries that reach that rank.
But some of the differences are useful. A backlink profile can show you what a brand is known for.
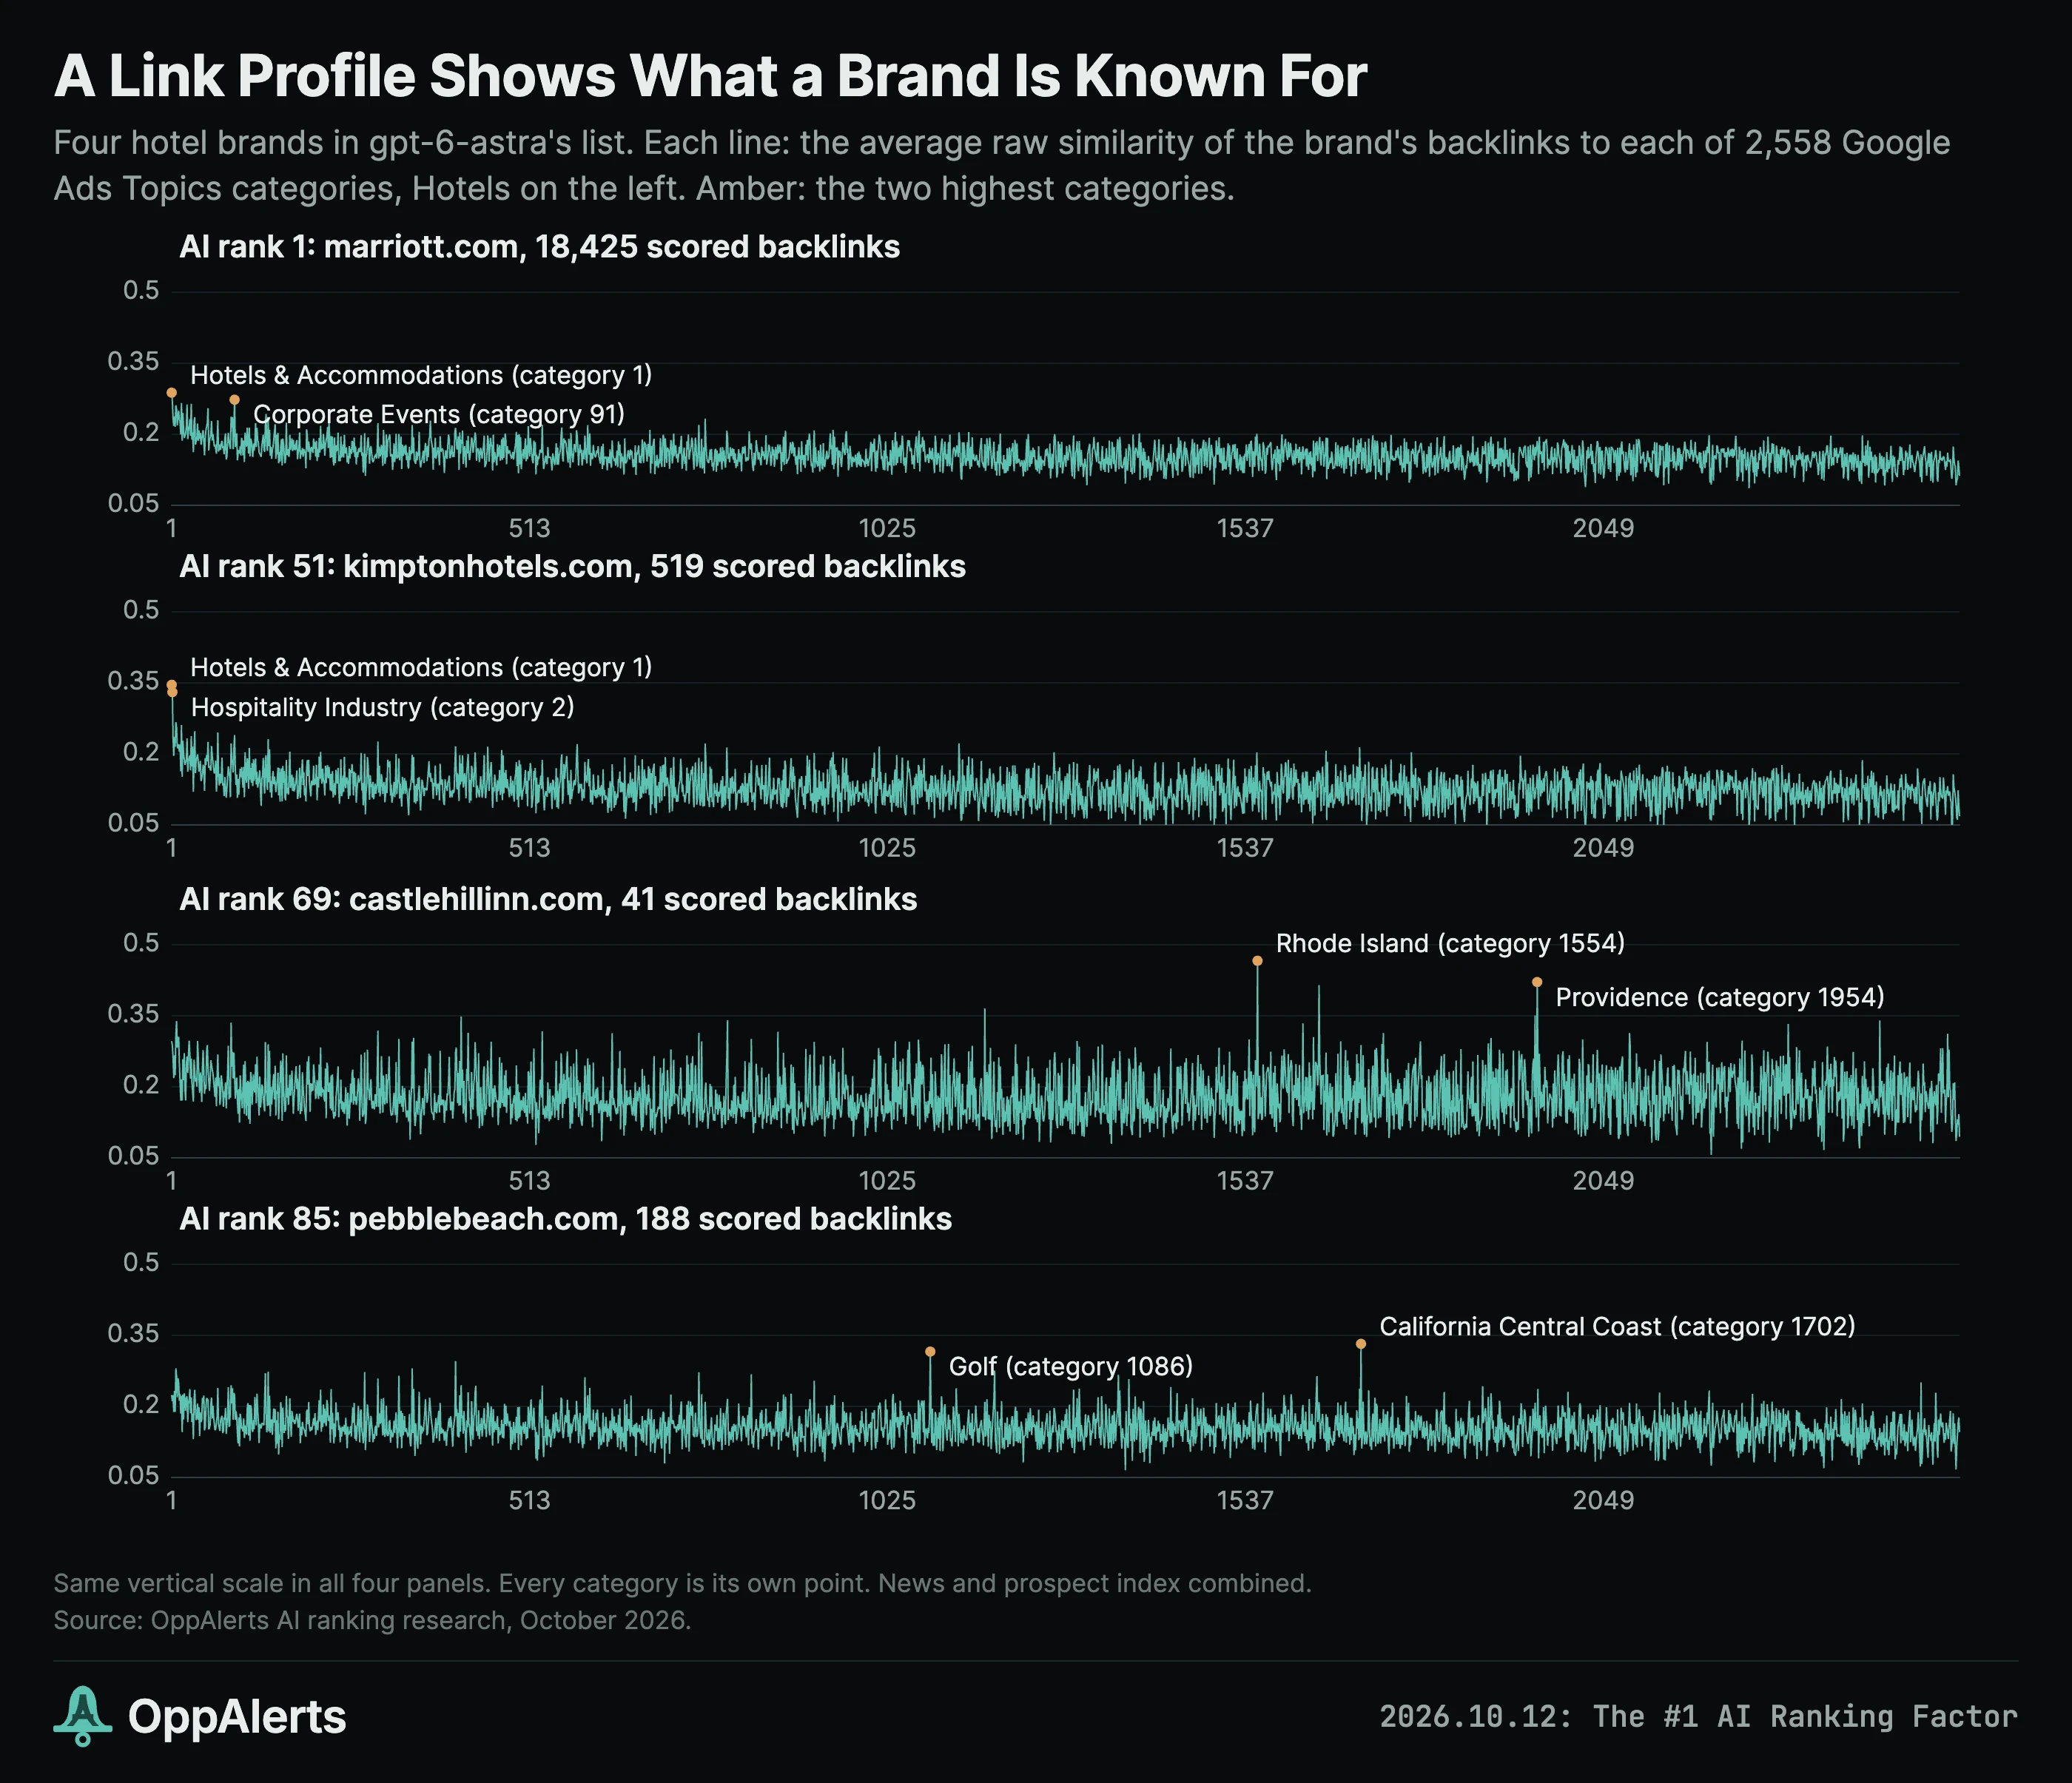
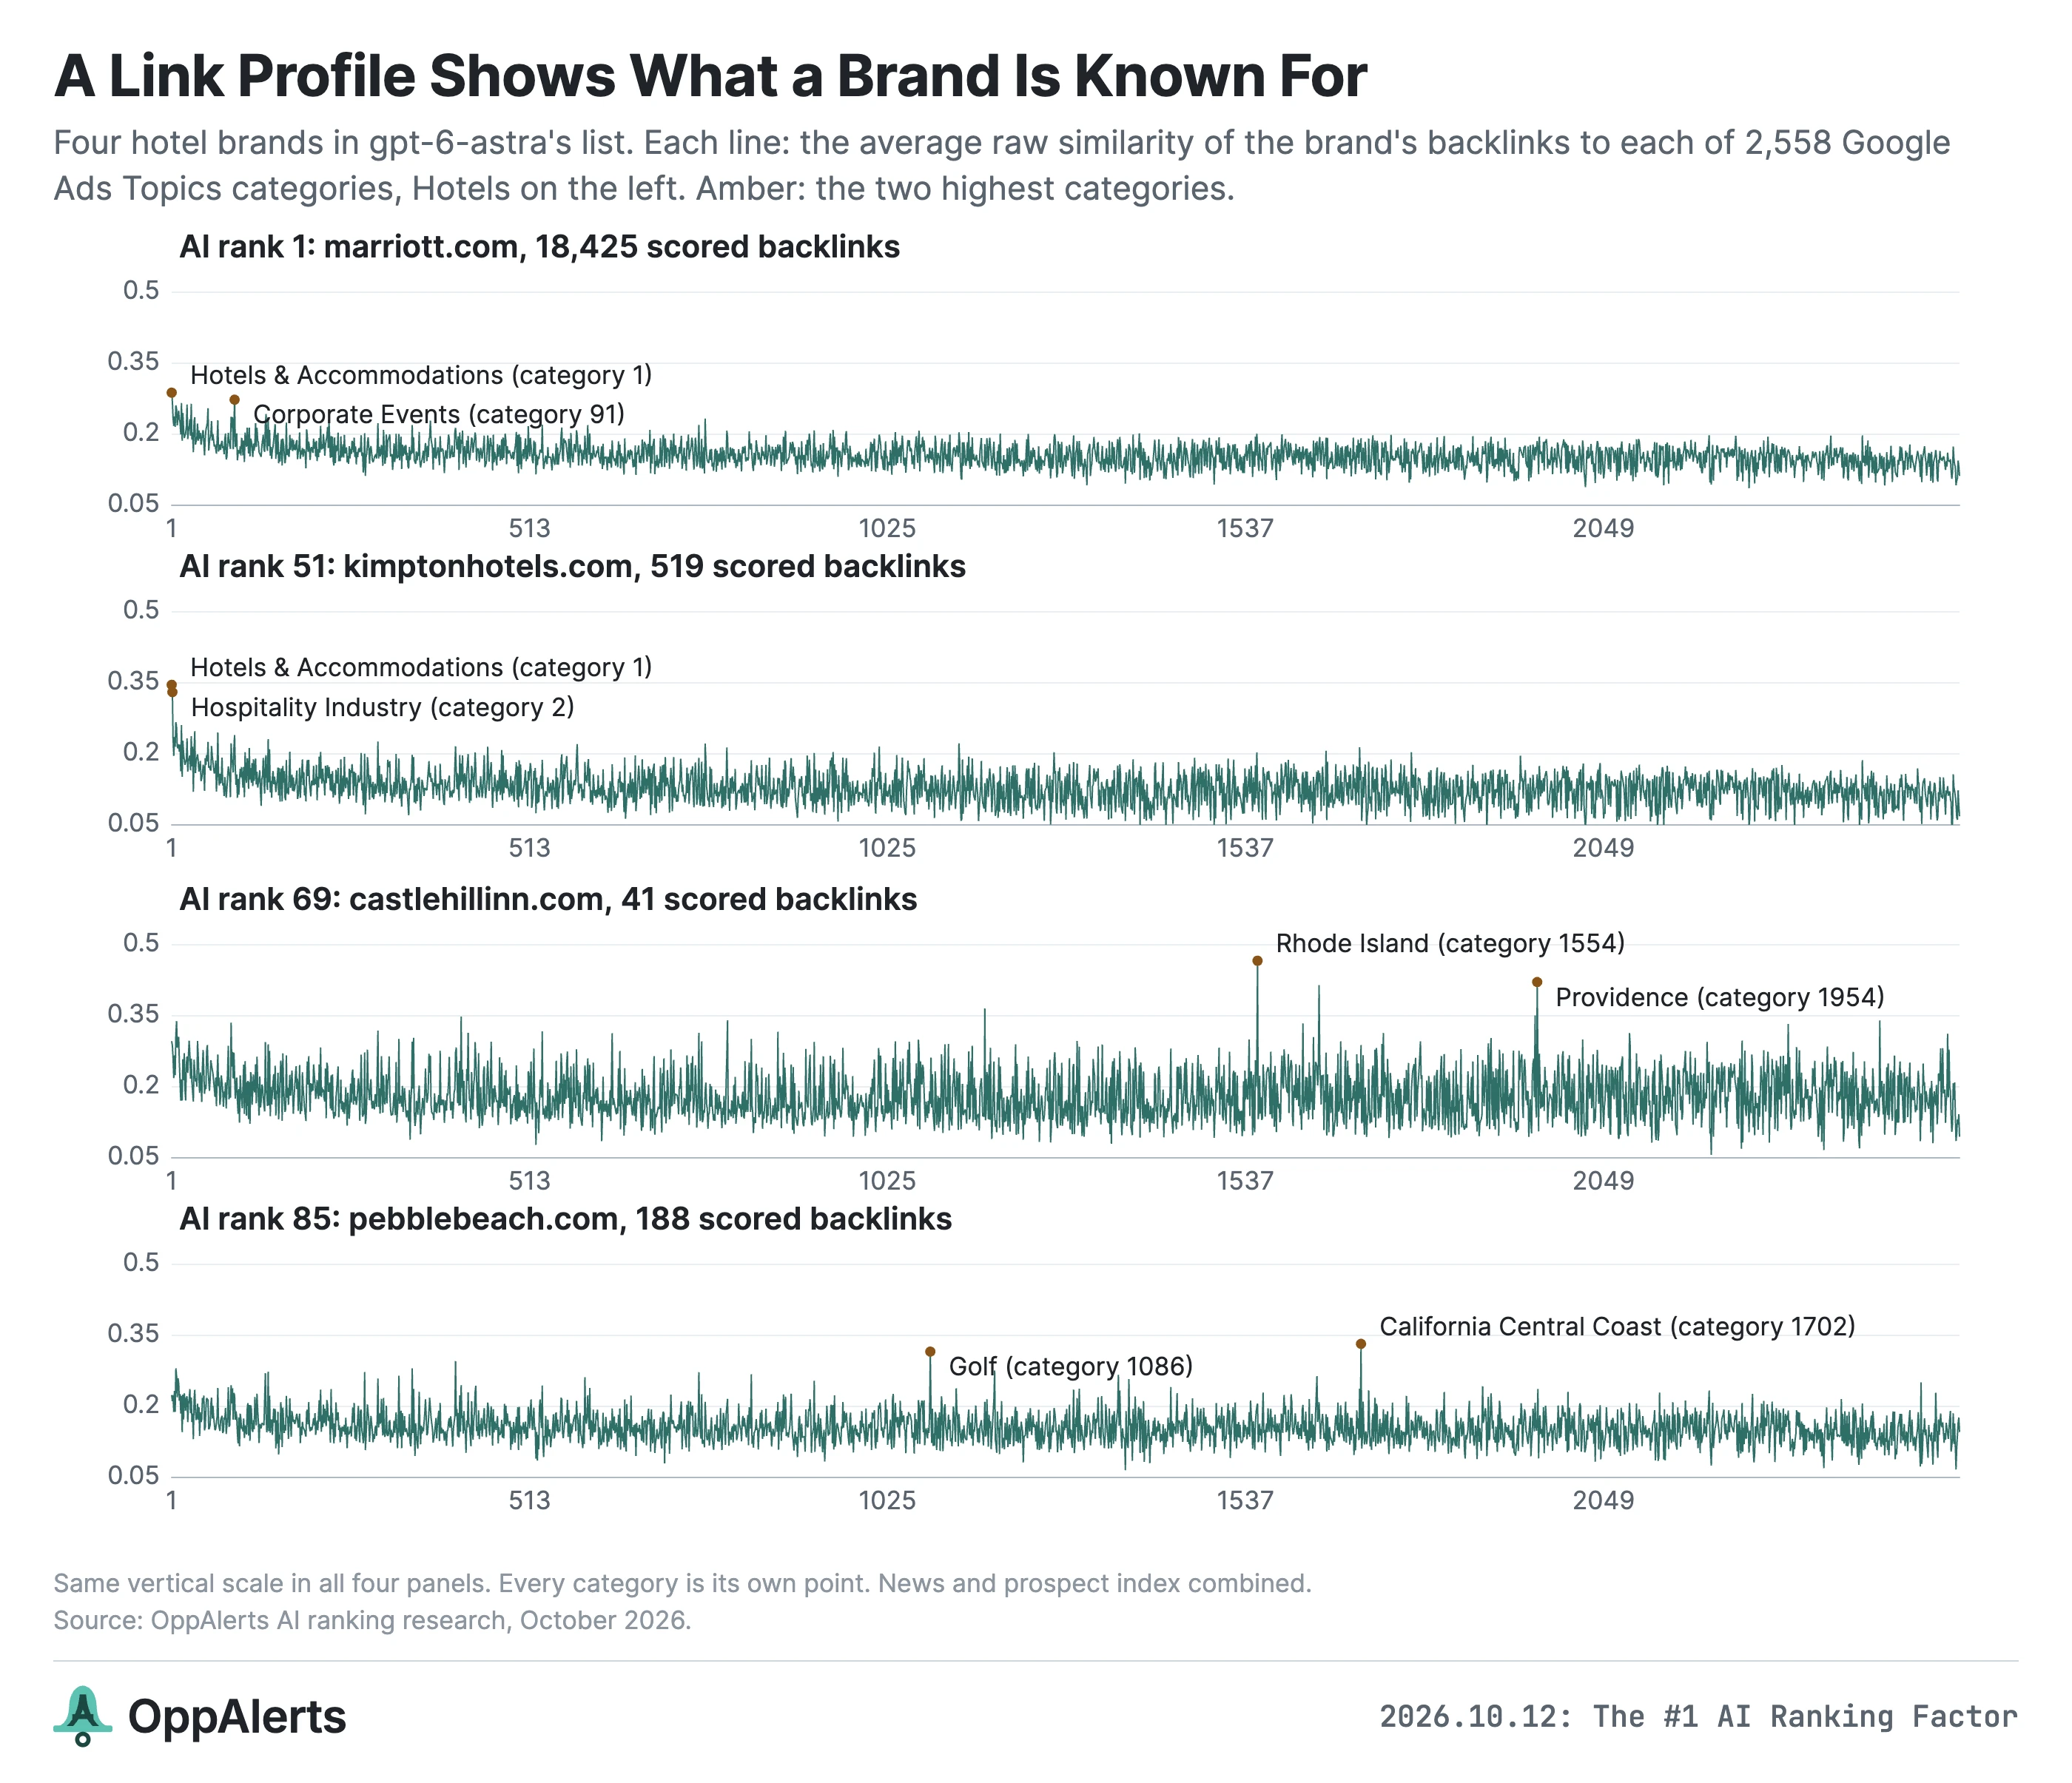
Marriott and Hilton both have Hotels & Accommodations, Corporate Events, Hospitality Industry, and Business Travel as their top four categories.
Kimpton, at rank 51, has Hotels & Accommodations, Hospitality Industry, Luxury Travel, and Business Travel.
Castle Hill Inn, at rank 69, has 41 backlinks. Its top categories are Rhode Island, Providence, New England, and Maine. The pages linking to it are strongly associated with where it is.
Pebble Beach, at rank 85, has California Central Coast and Golf near the top.
That all makes sense.
The Broadmoor is a useful reminder to check the page count. It's at rank 25, but the indexes have only one backlink for it. Its entire profile comes from that page: Luxury Travel, Specialty Travel, Massage Therapy, and Honeymoons. That's too little to describe the whole brand.
You can see similar patterns in the airline industry. Delta's top IAB Content categories are Air Travel, Business Travel, and Travel Preparation. Regional airlines Envoy, Endeavor, and Piedmont also have “Careers > Apprenticeships” near the top. CommutAir has “Careers > Vocational Training.”
Pages about pilot careers and training are part of those airlines' backlink profiles.
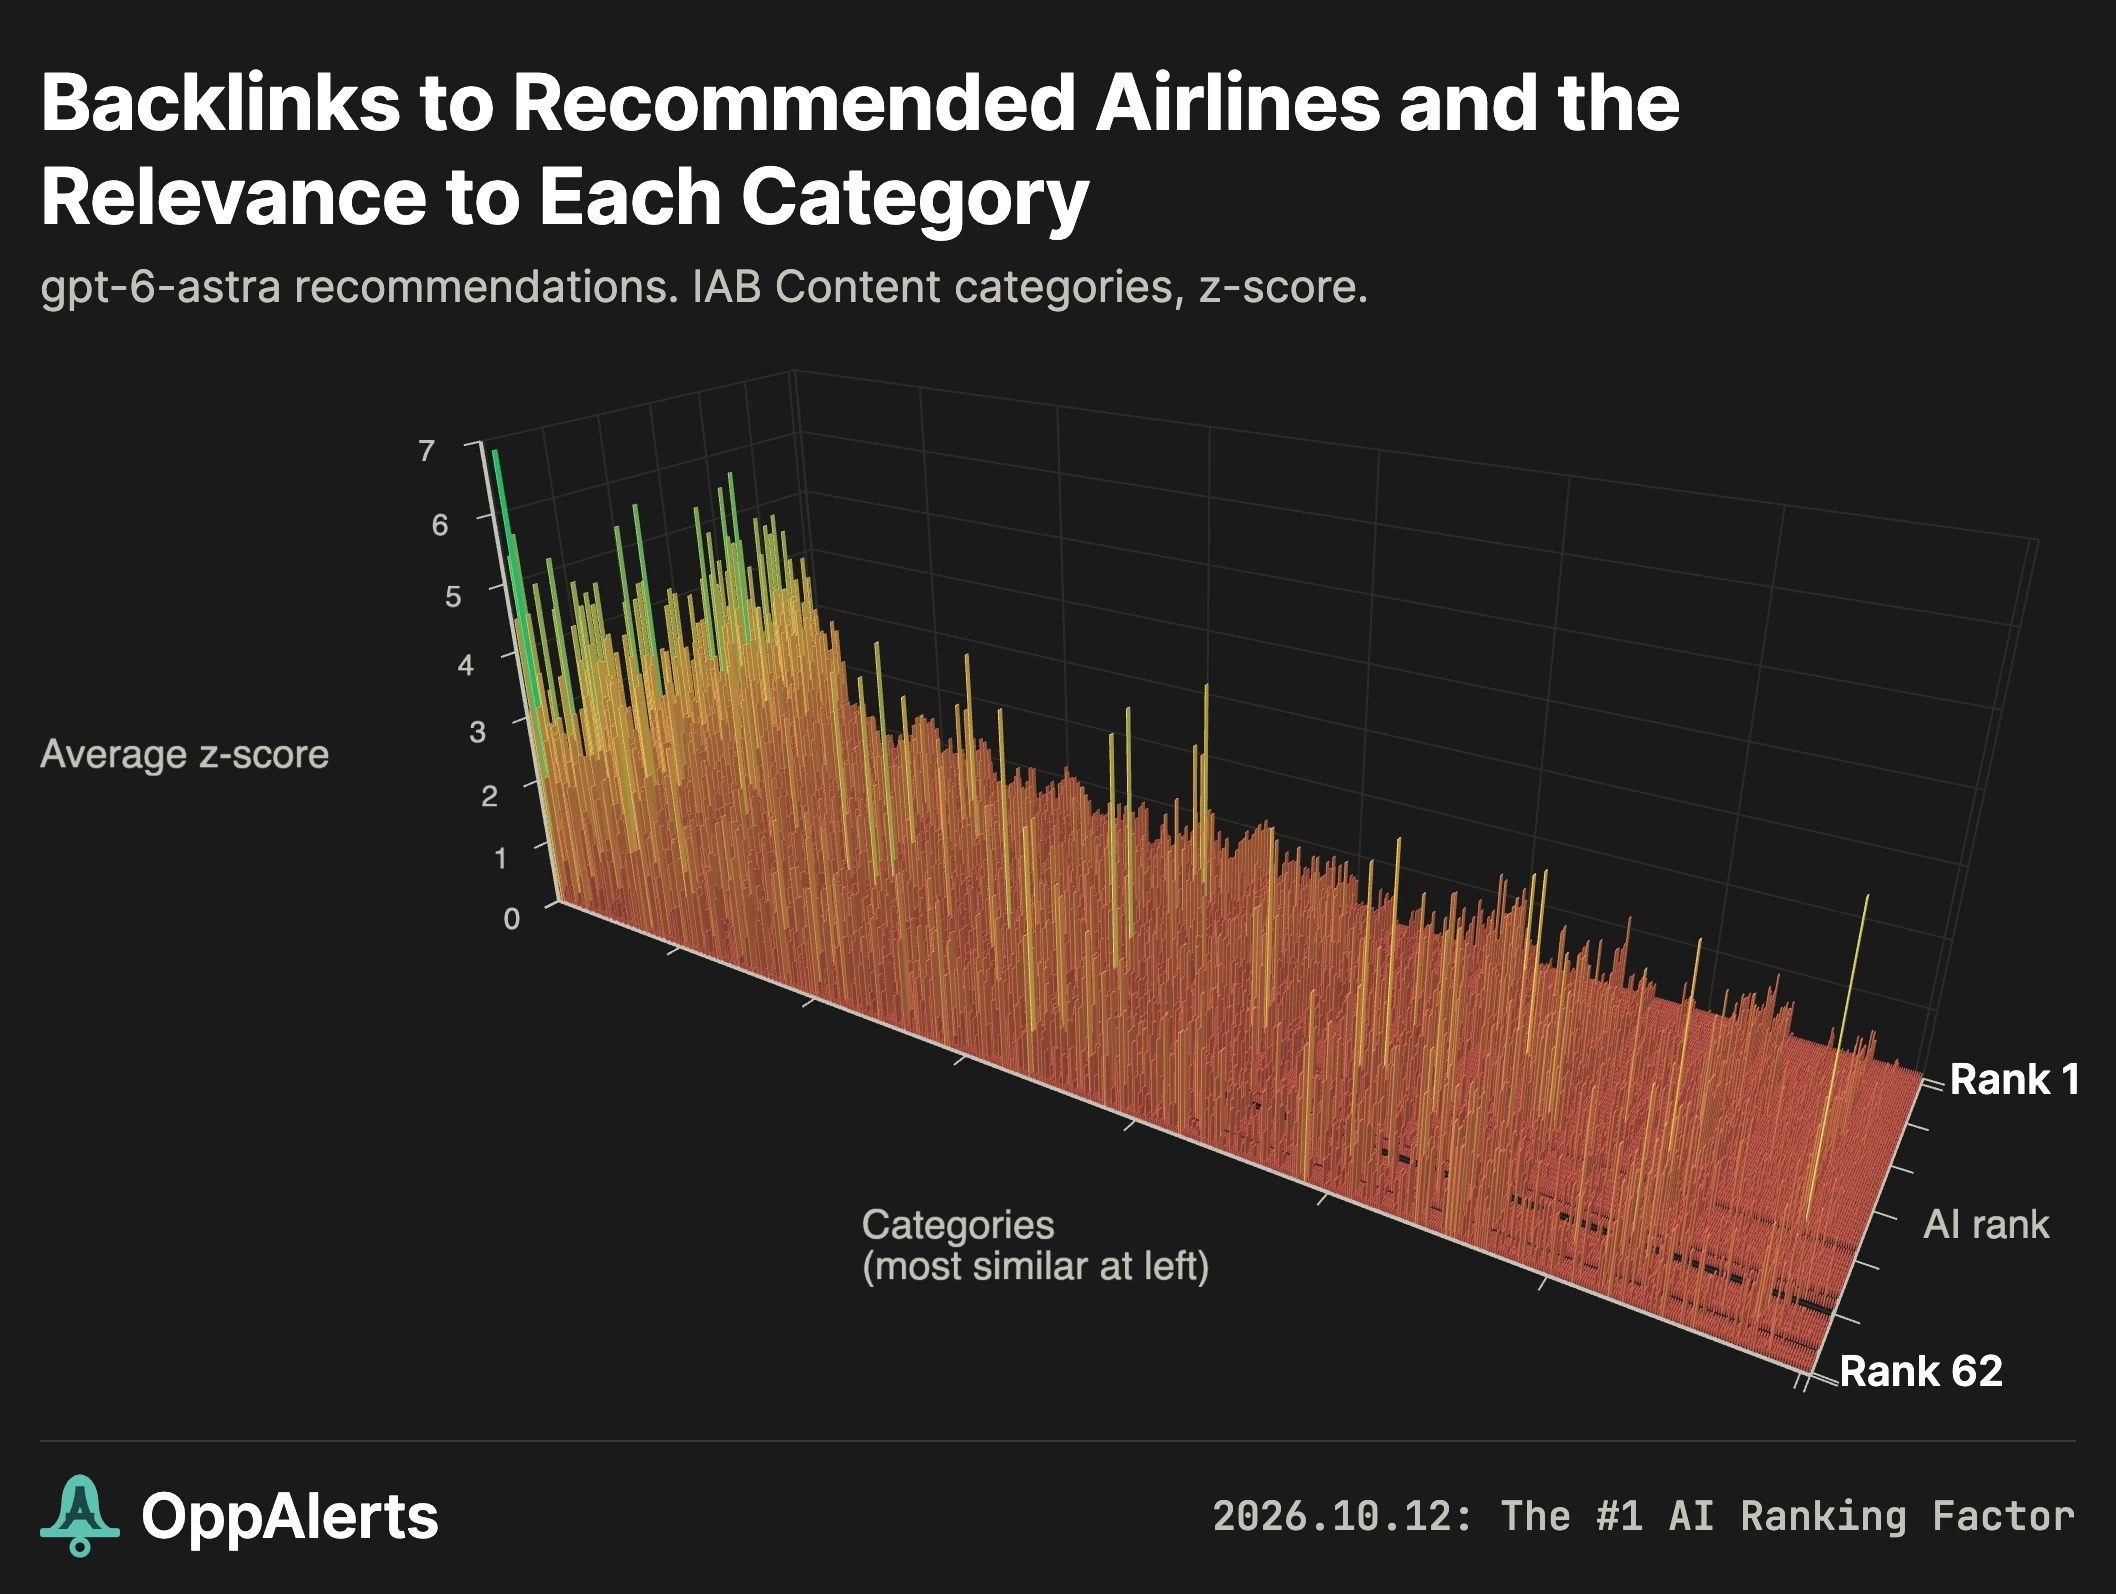
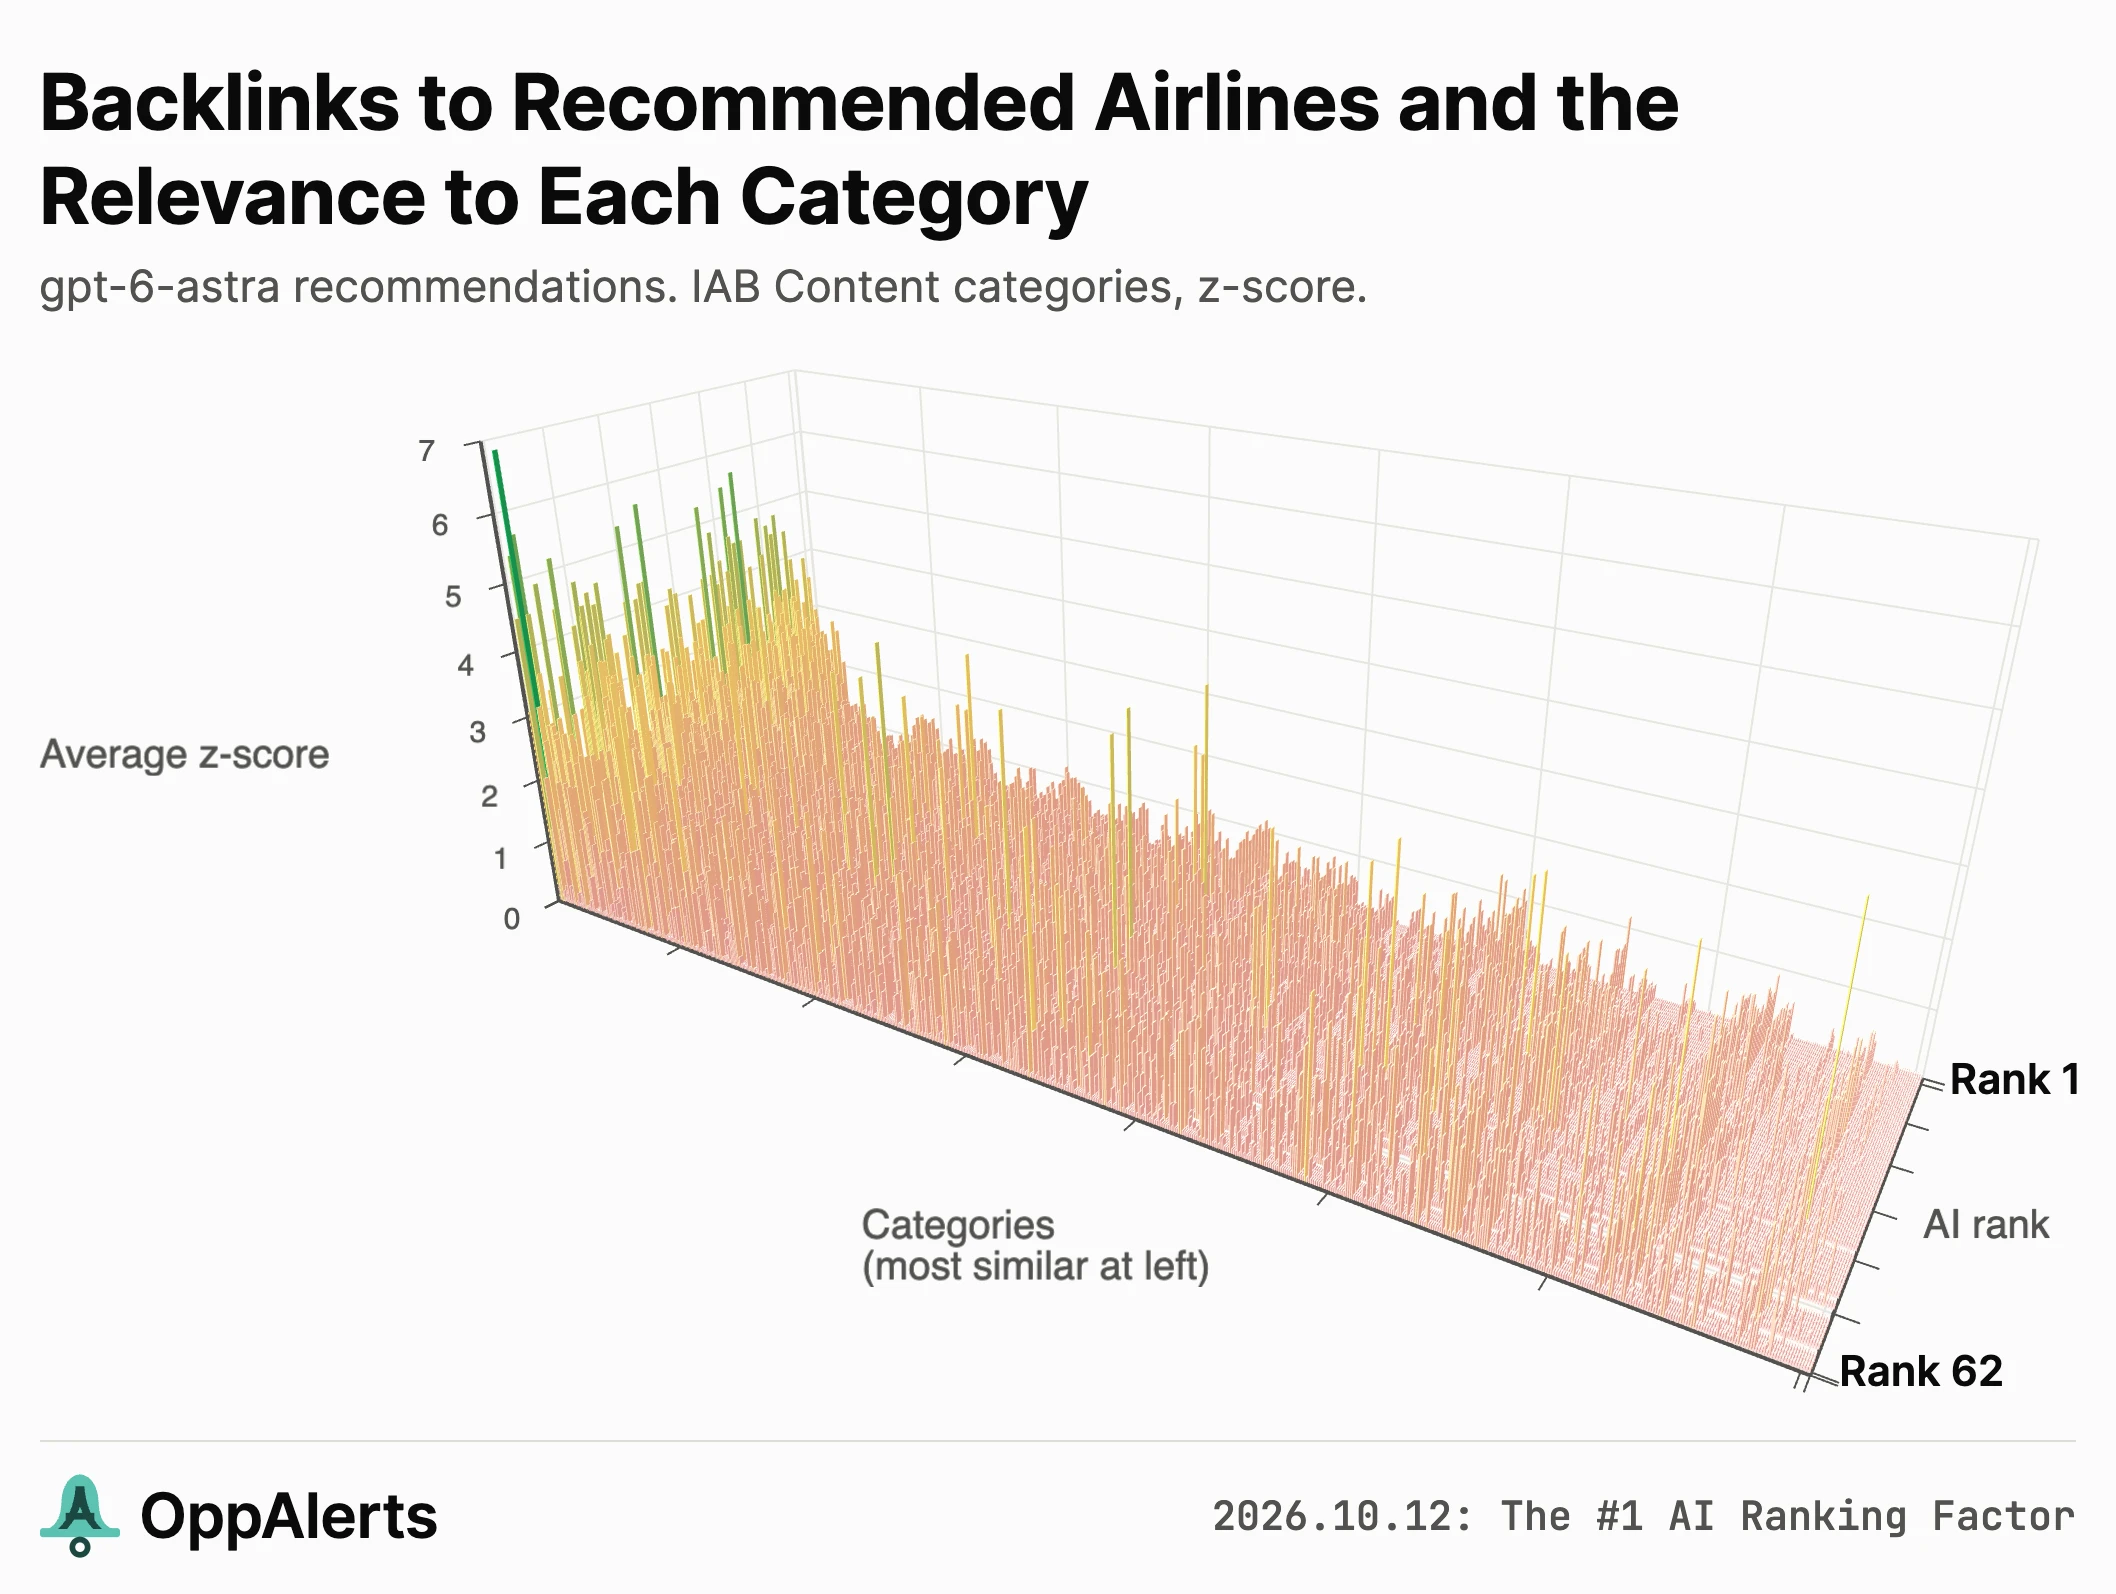
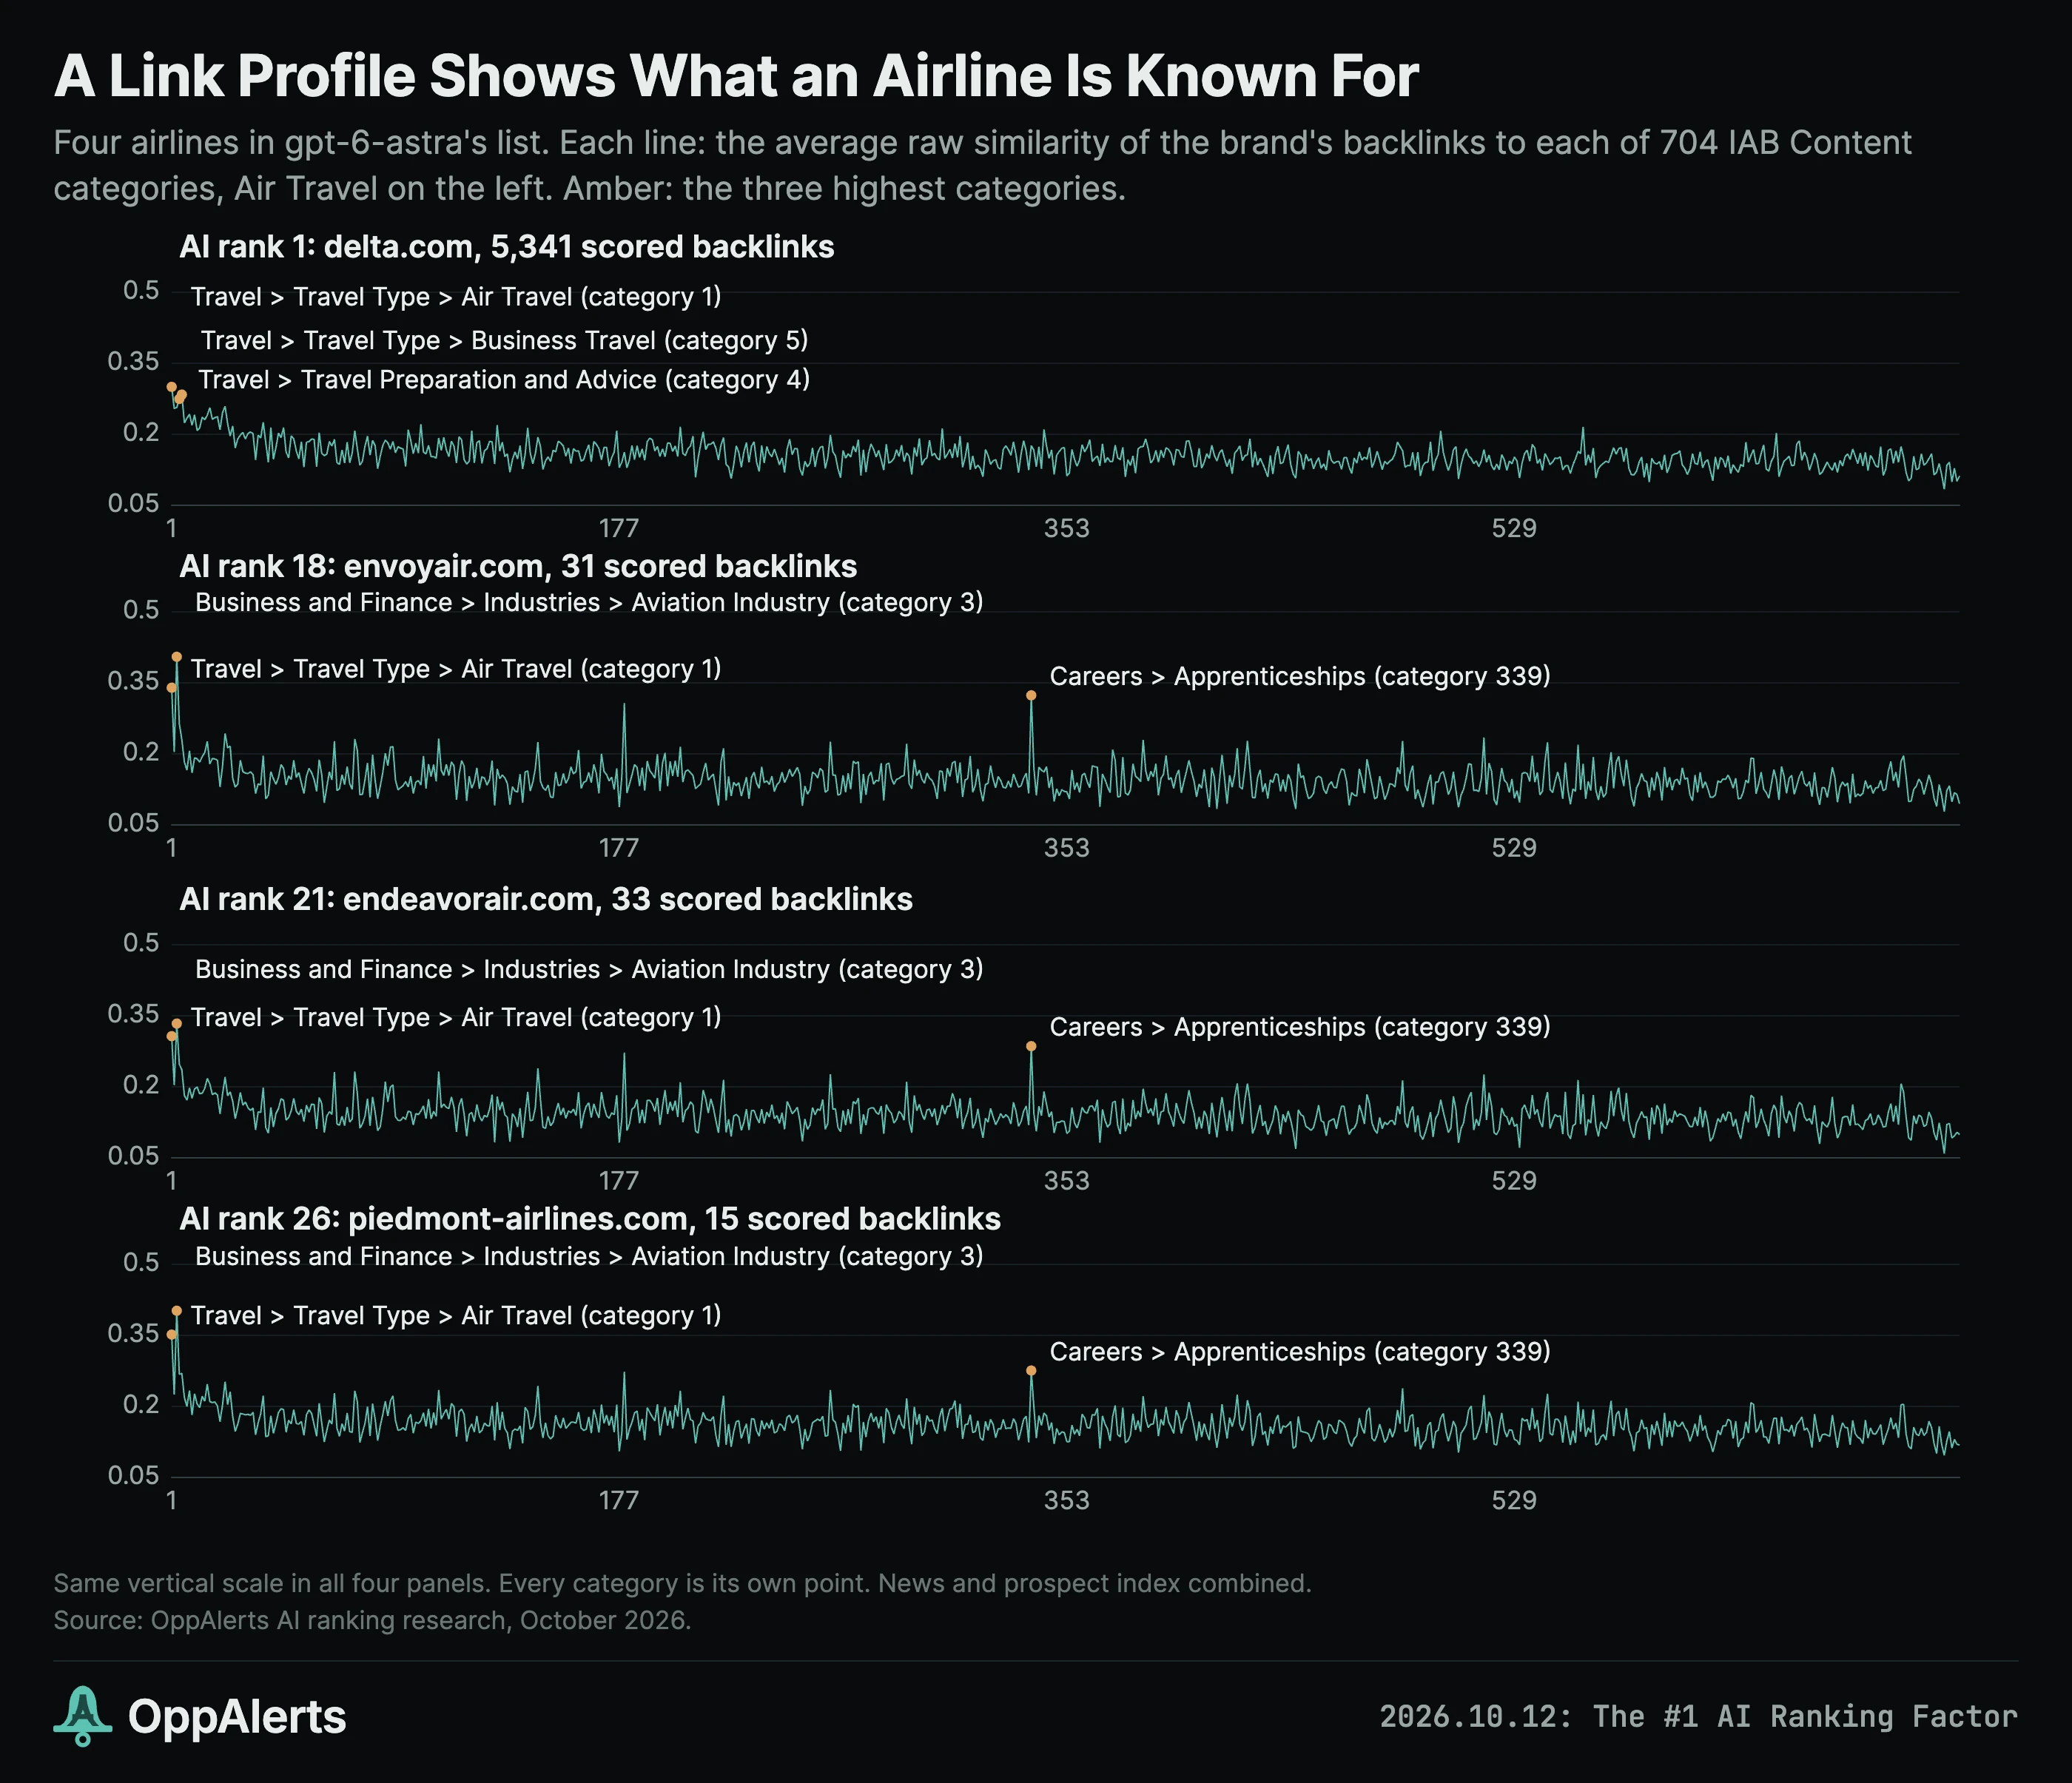
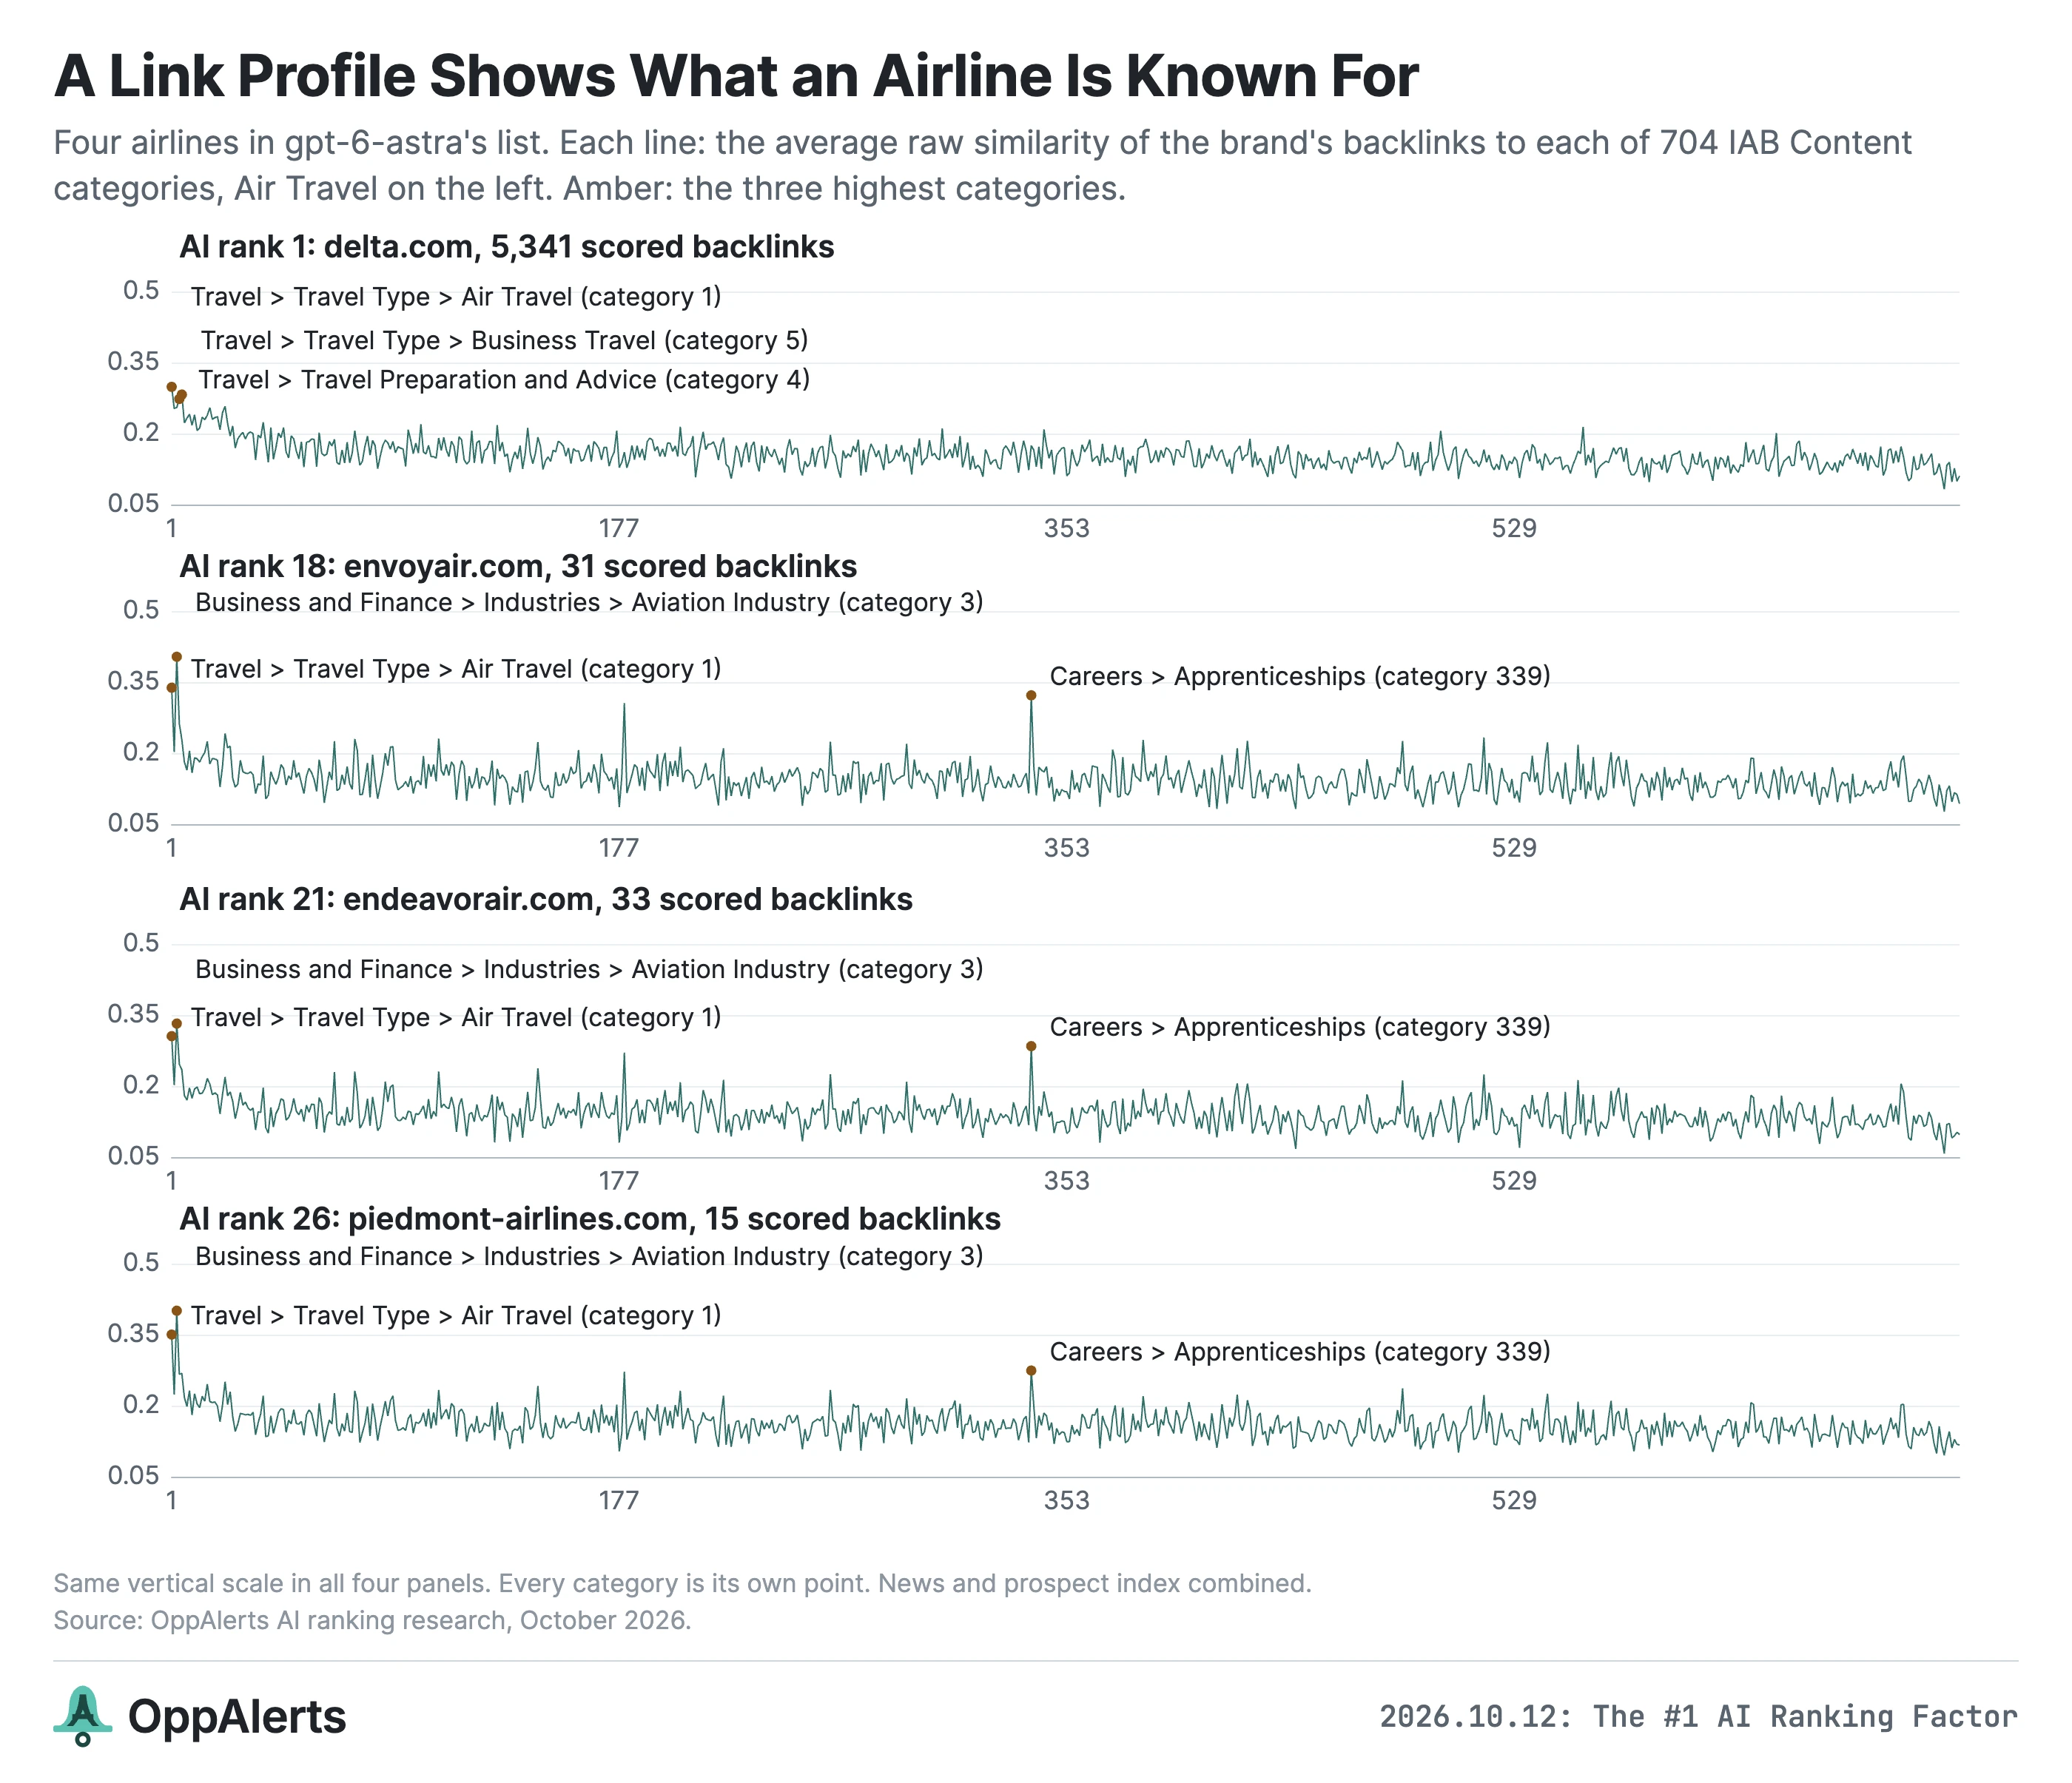
This is useful when you're looking at your own brand. You can see the subjects people already connect you with, then compare that with what you want to be known for.
Four ways to look at the same pages
I scored the data four different ways. I'm including them because each makes a different part of the picture easier to see.
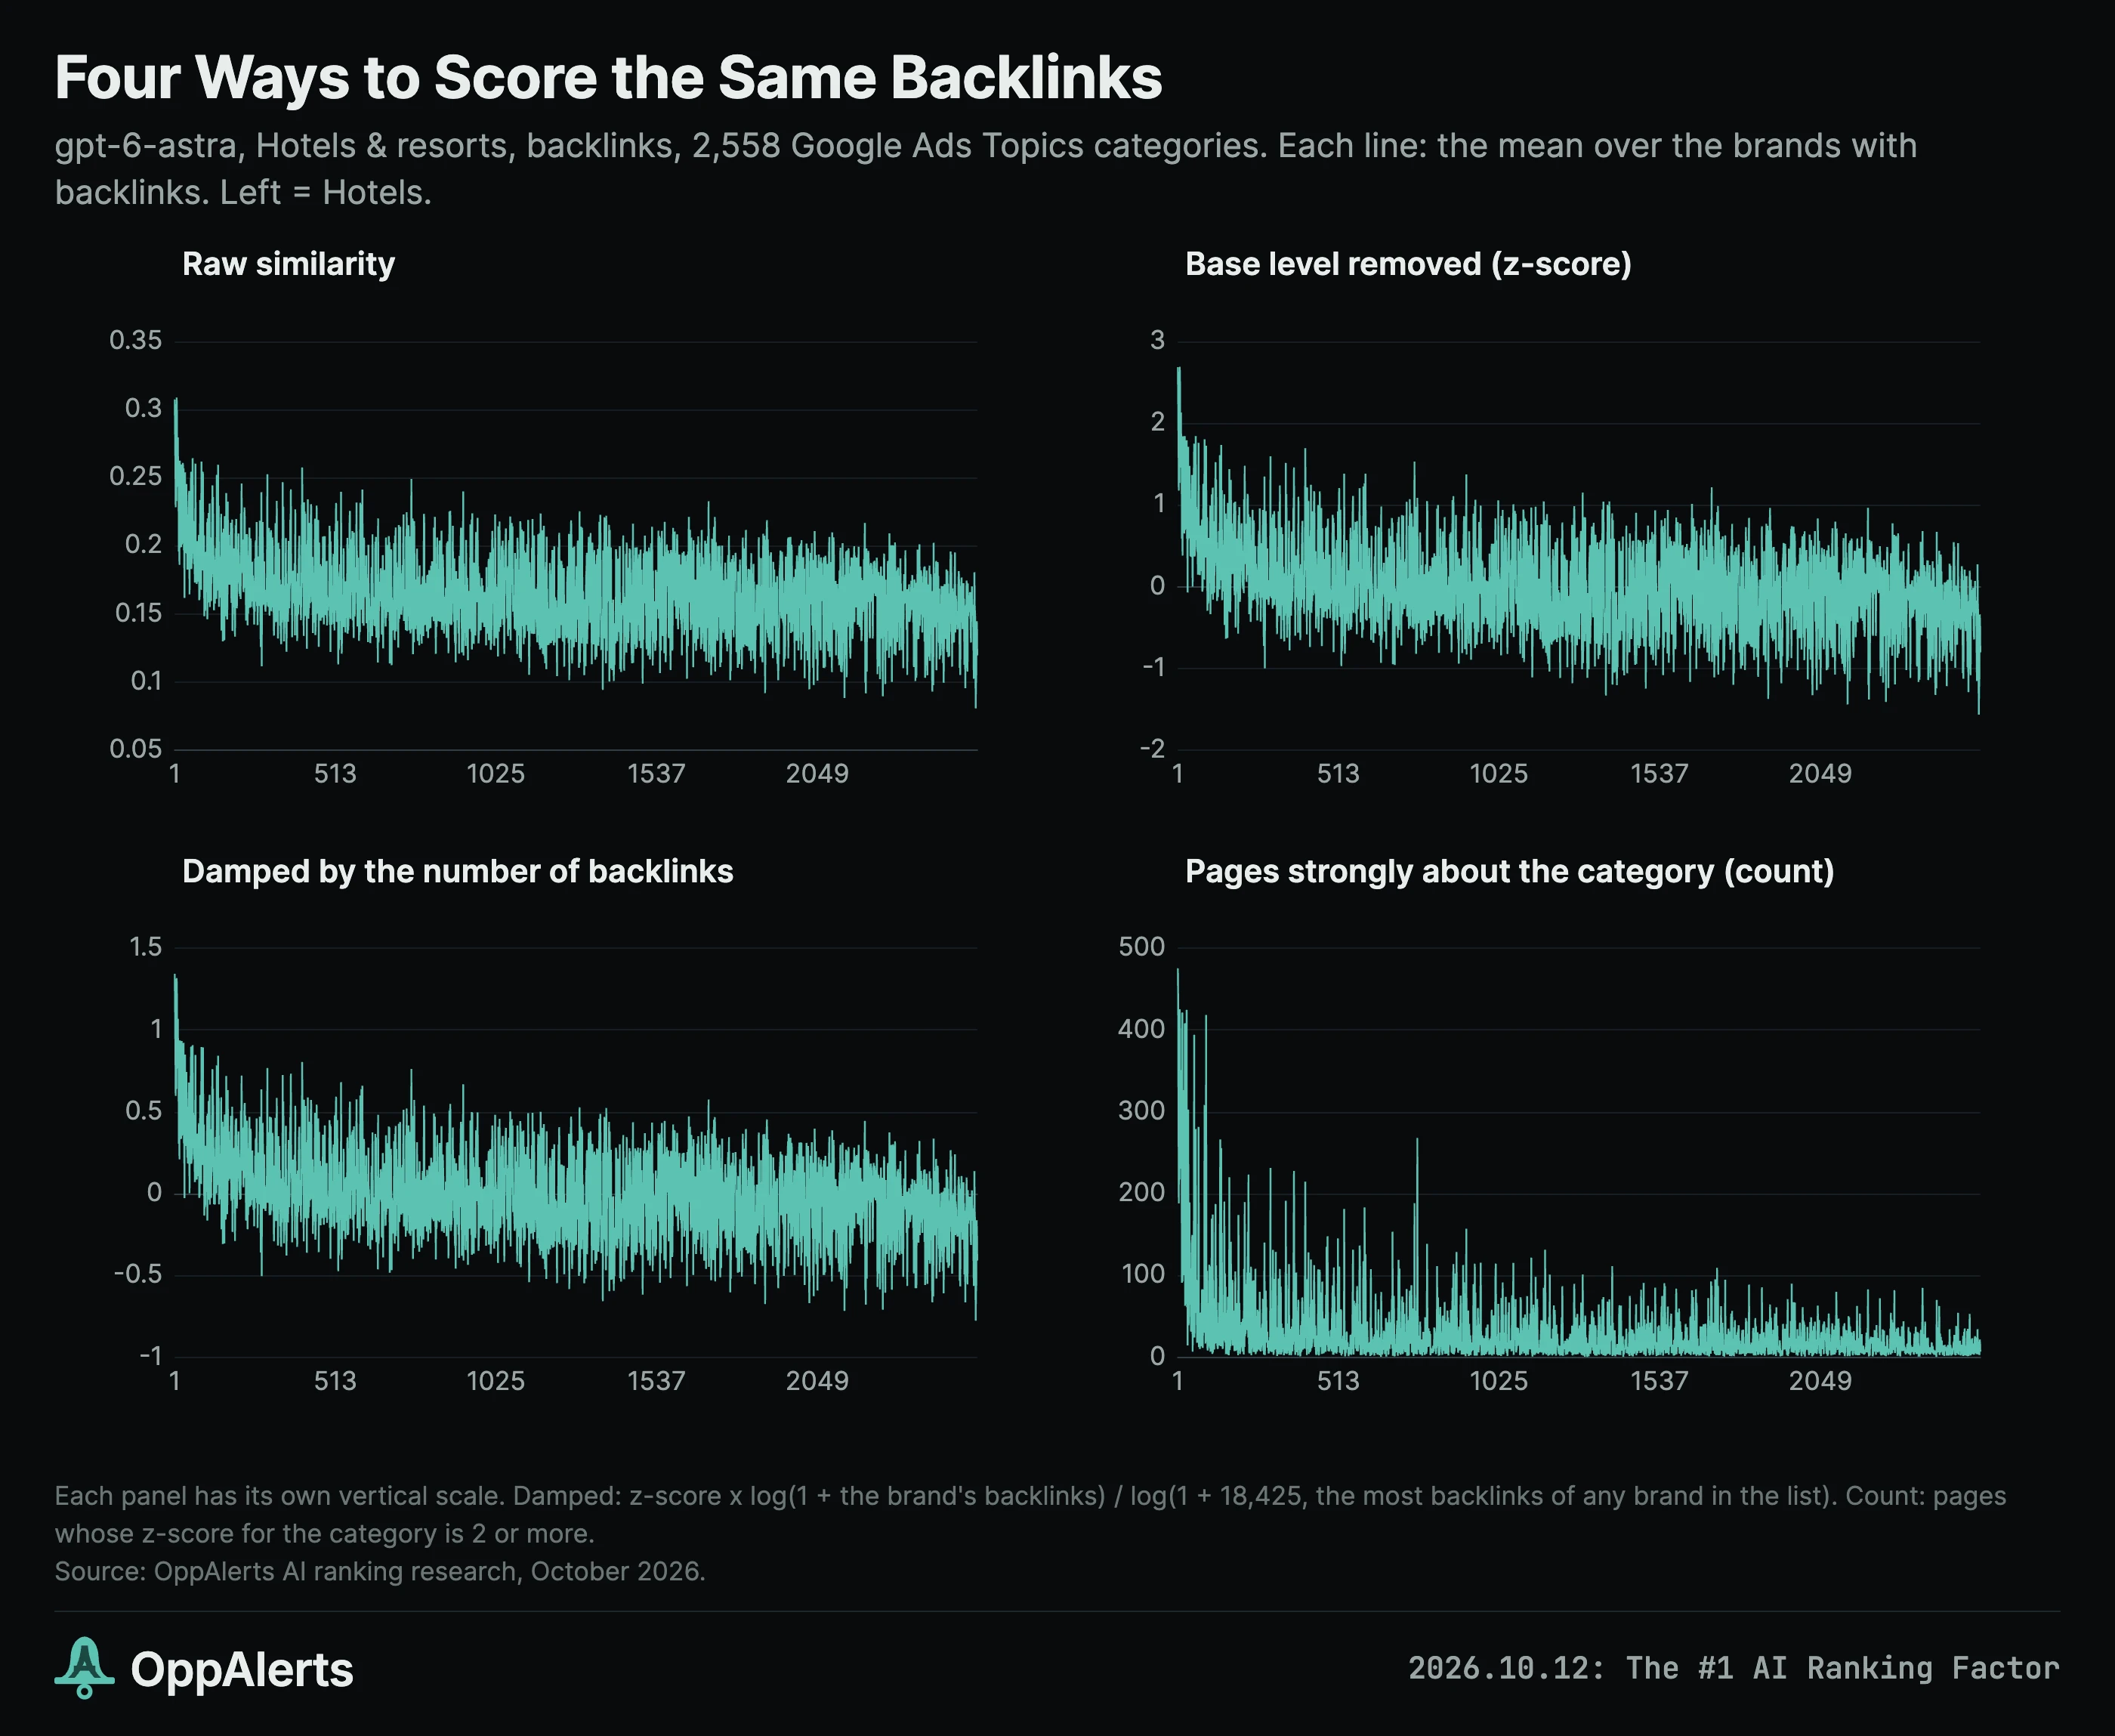
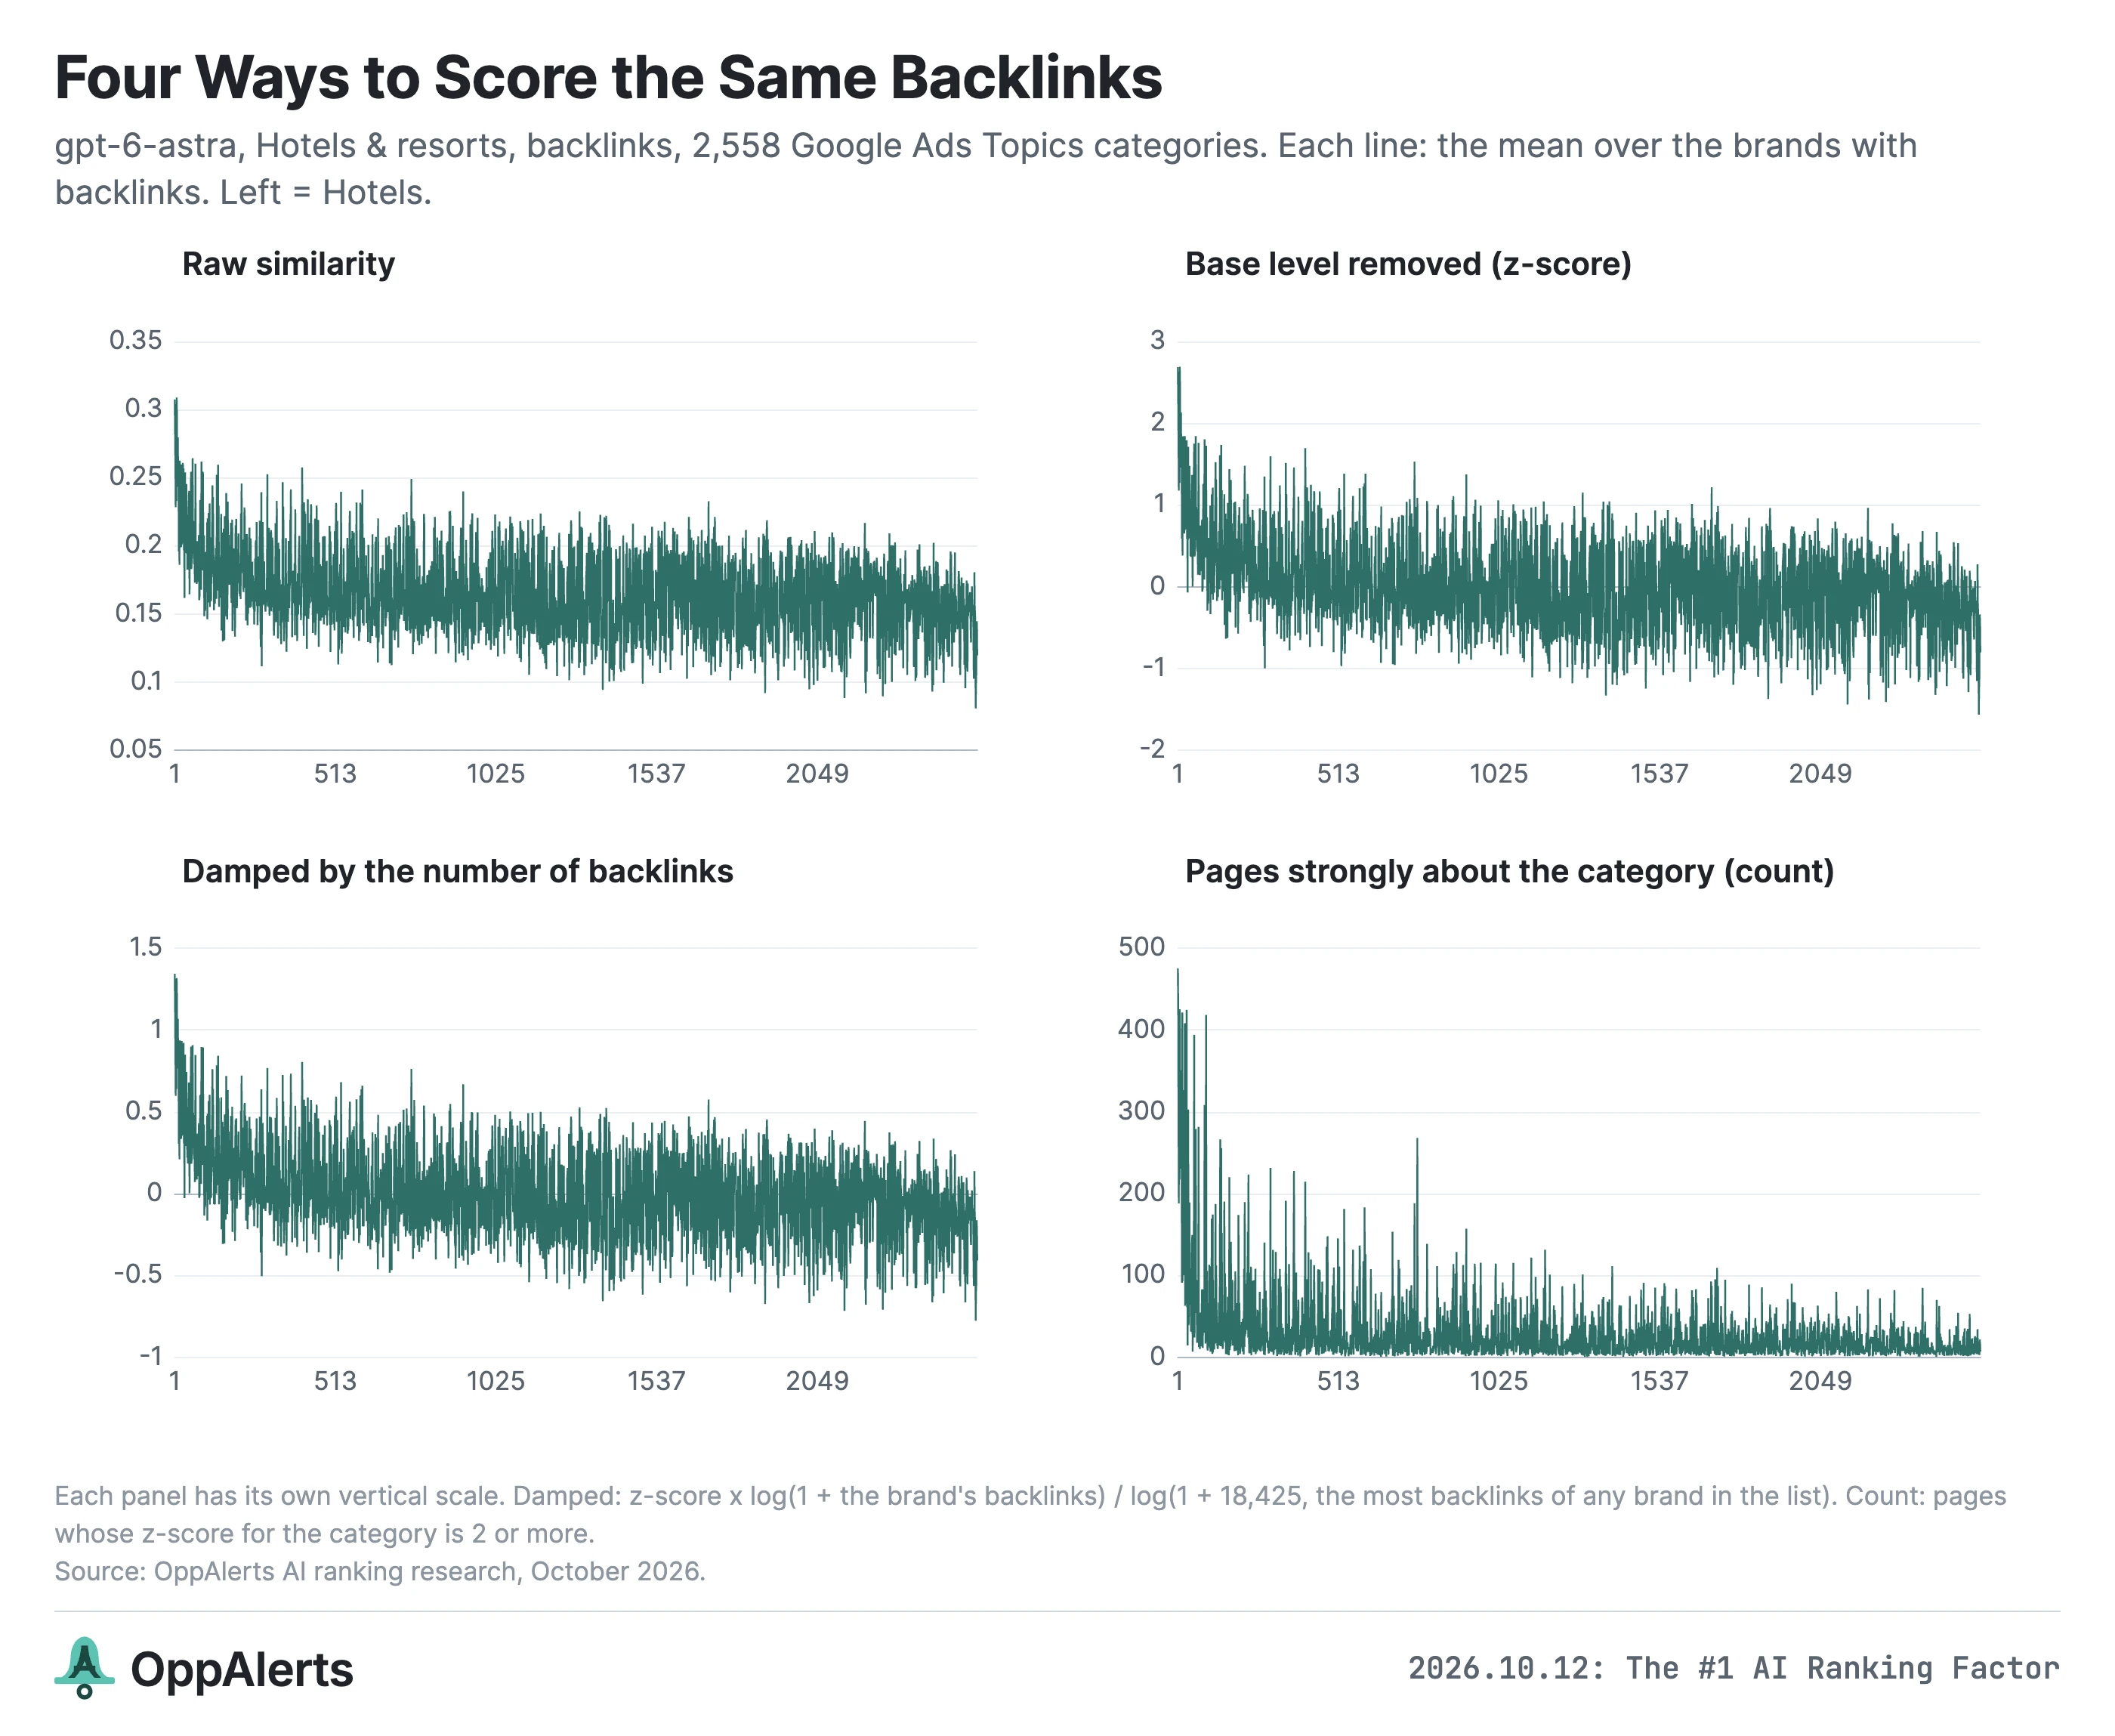
Raw similarity is the most direct. Take each page's similarity to a category and average it across the brand's pages. This is what I use for most of the charts combining all industries. Some pages score a little higher against everything, though, which can move a whole row up.
Base level removed, or z-score, adjusts for that. Subtract a page's average similarity, then divide by its standard deviation. Zero means an average category for that page. Higher scores show which categories stand out.
For GPT-6 Astra's top 10 brands across all industries, the industry's own category is 3.2 standard deviations above the page average in Google Ads Topics, and 2.7 to 2.8 in the other taxonomies.
The limitation is that one page can produce a bar just as tall as 10,000 pages. That's what we saw with The Broadmoor.
Damped starts with the z-score and reduces the height for brands with fewer pages. The multiplier is log(1 + the brand's page count) divided by log(1 + the largest page count in the chart). This makes it easier to see how much content is behind a profile.
Count shows how many pages are strongly about each category, using the z-score threshold of 2. This is the most direct view of volume. Large brands can dominate it, and one very large site can produce a jump at a particular rank when industries are averaged together.
Here's the hotel industry in all four views:
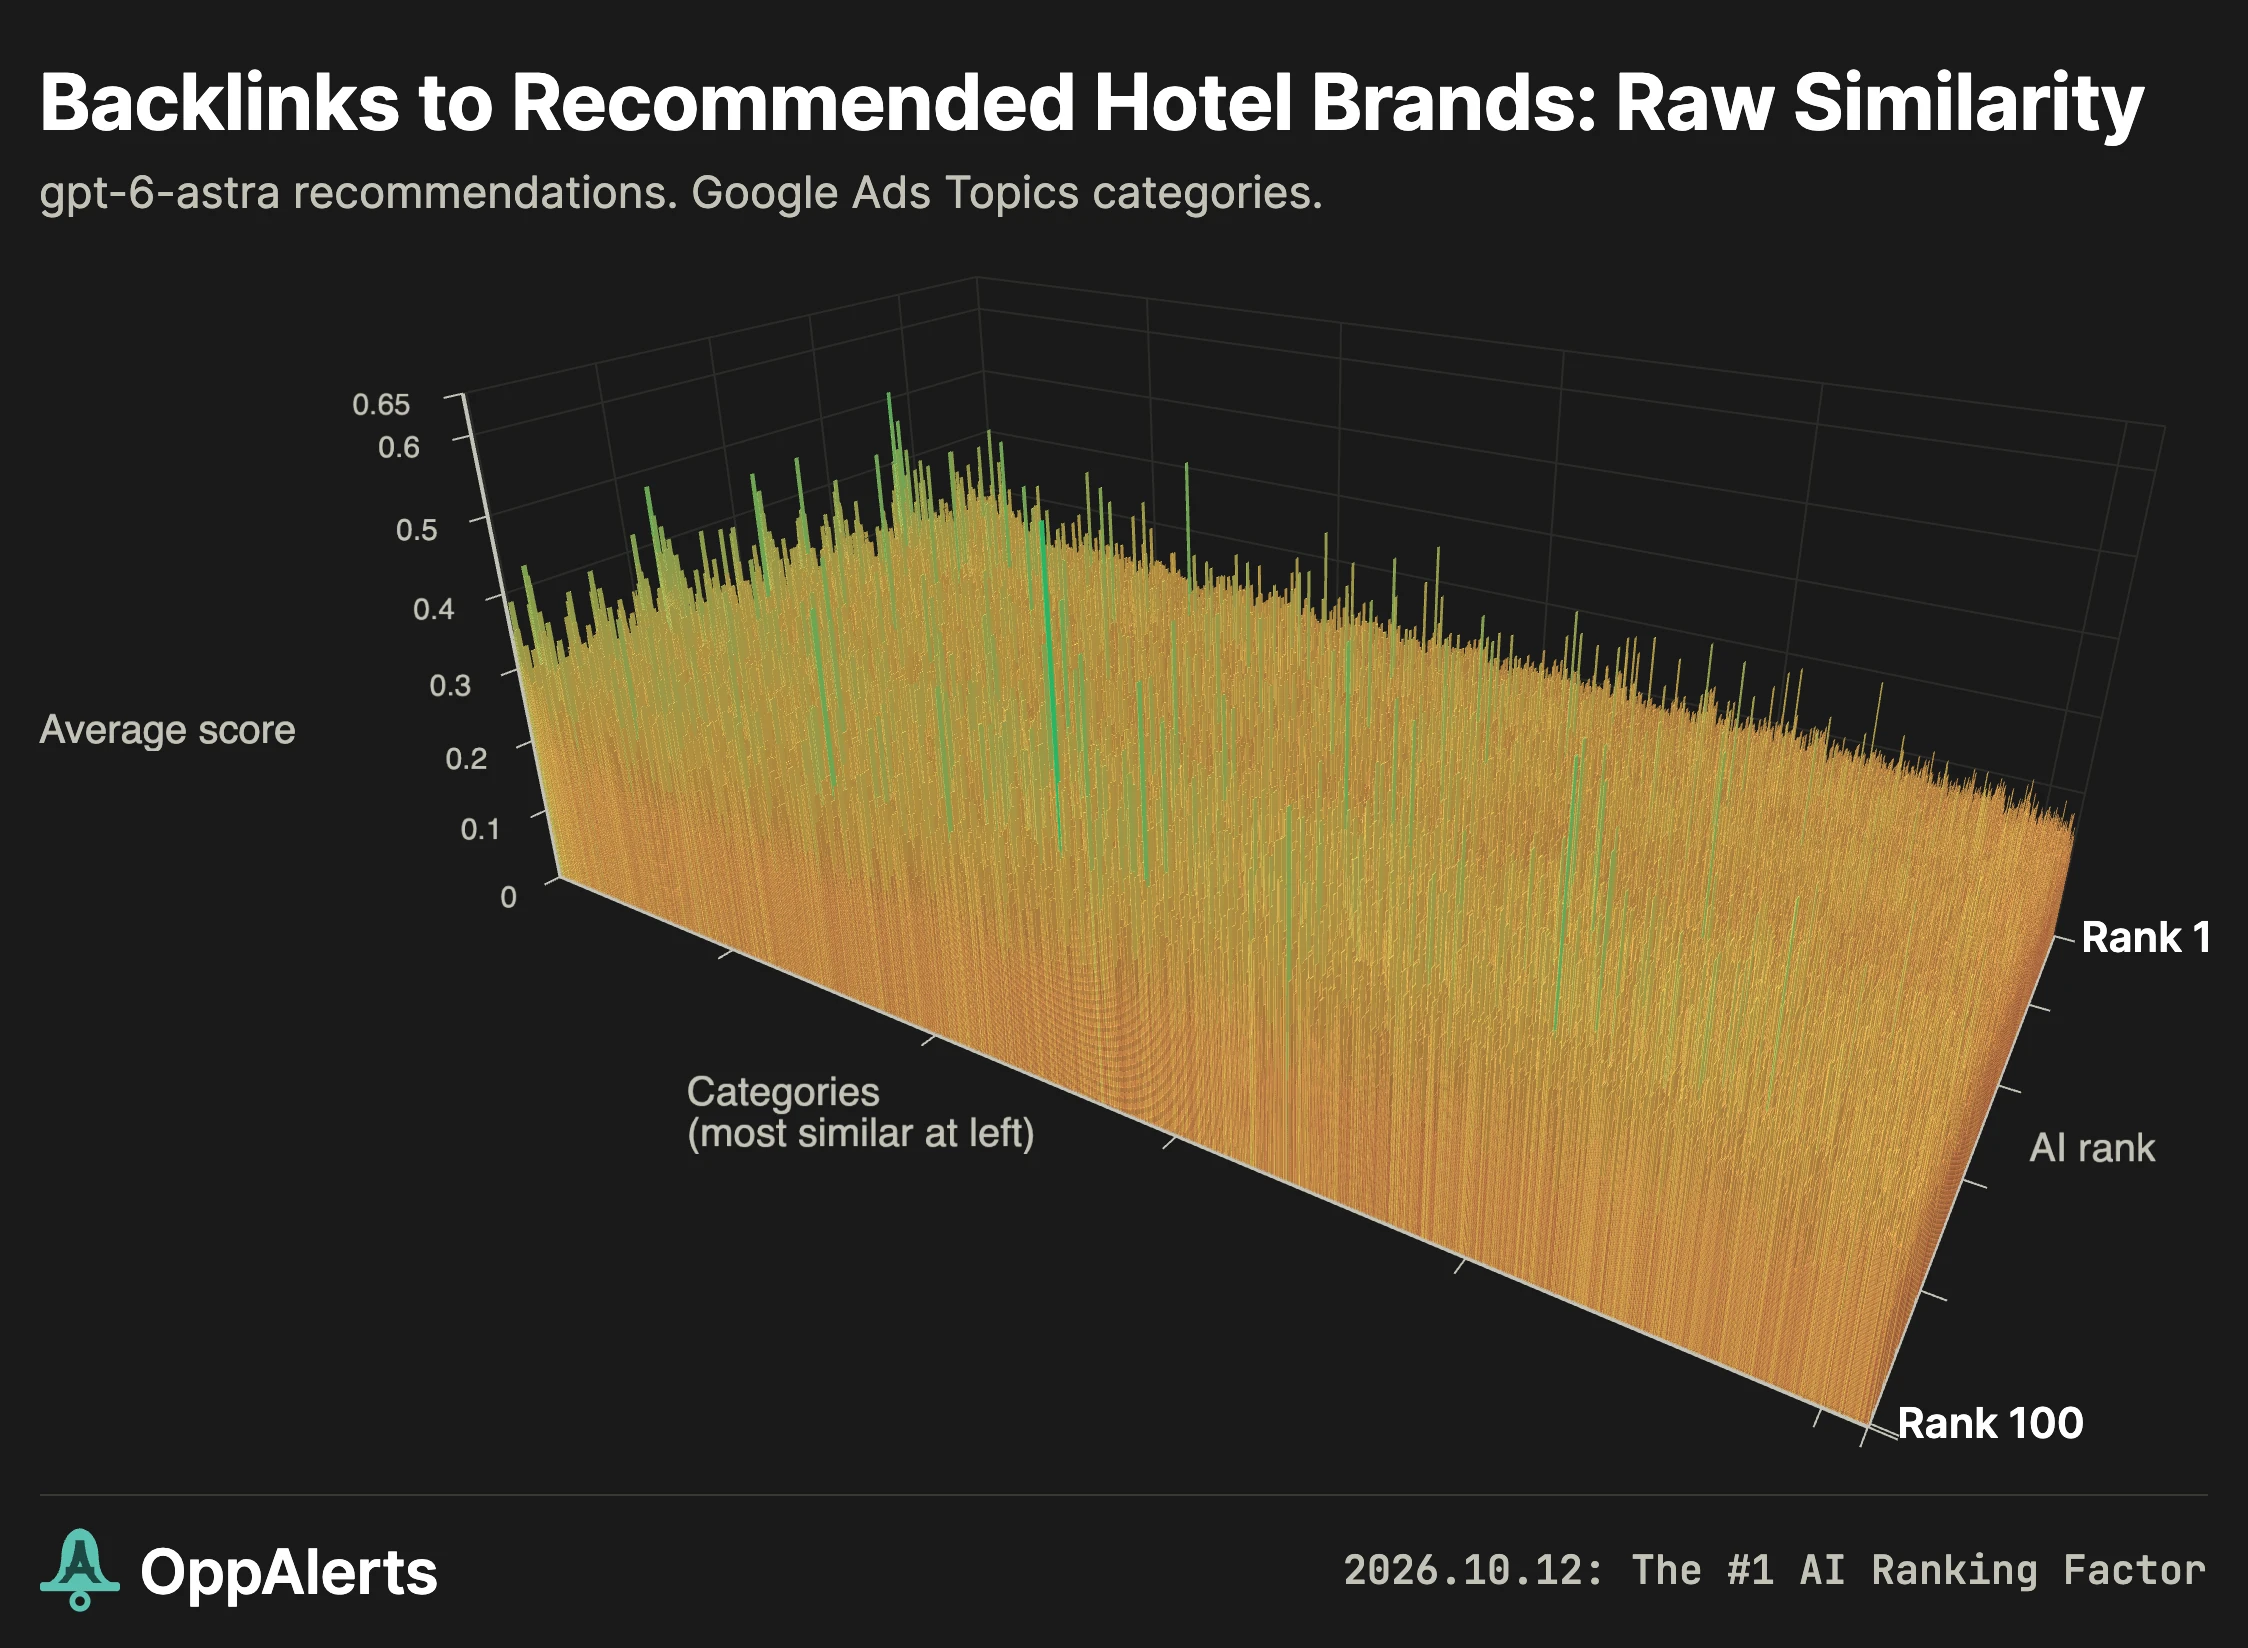
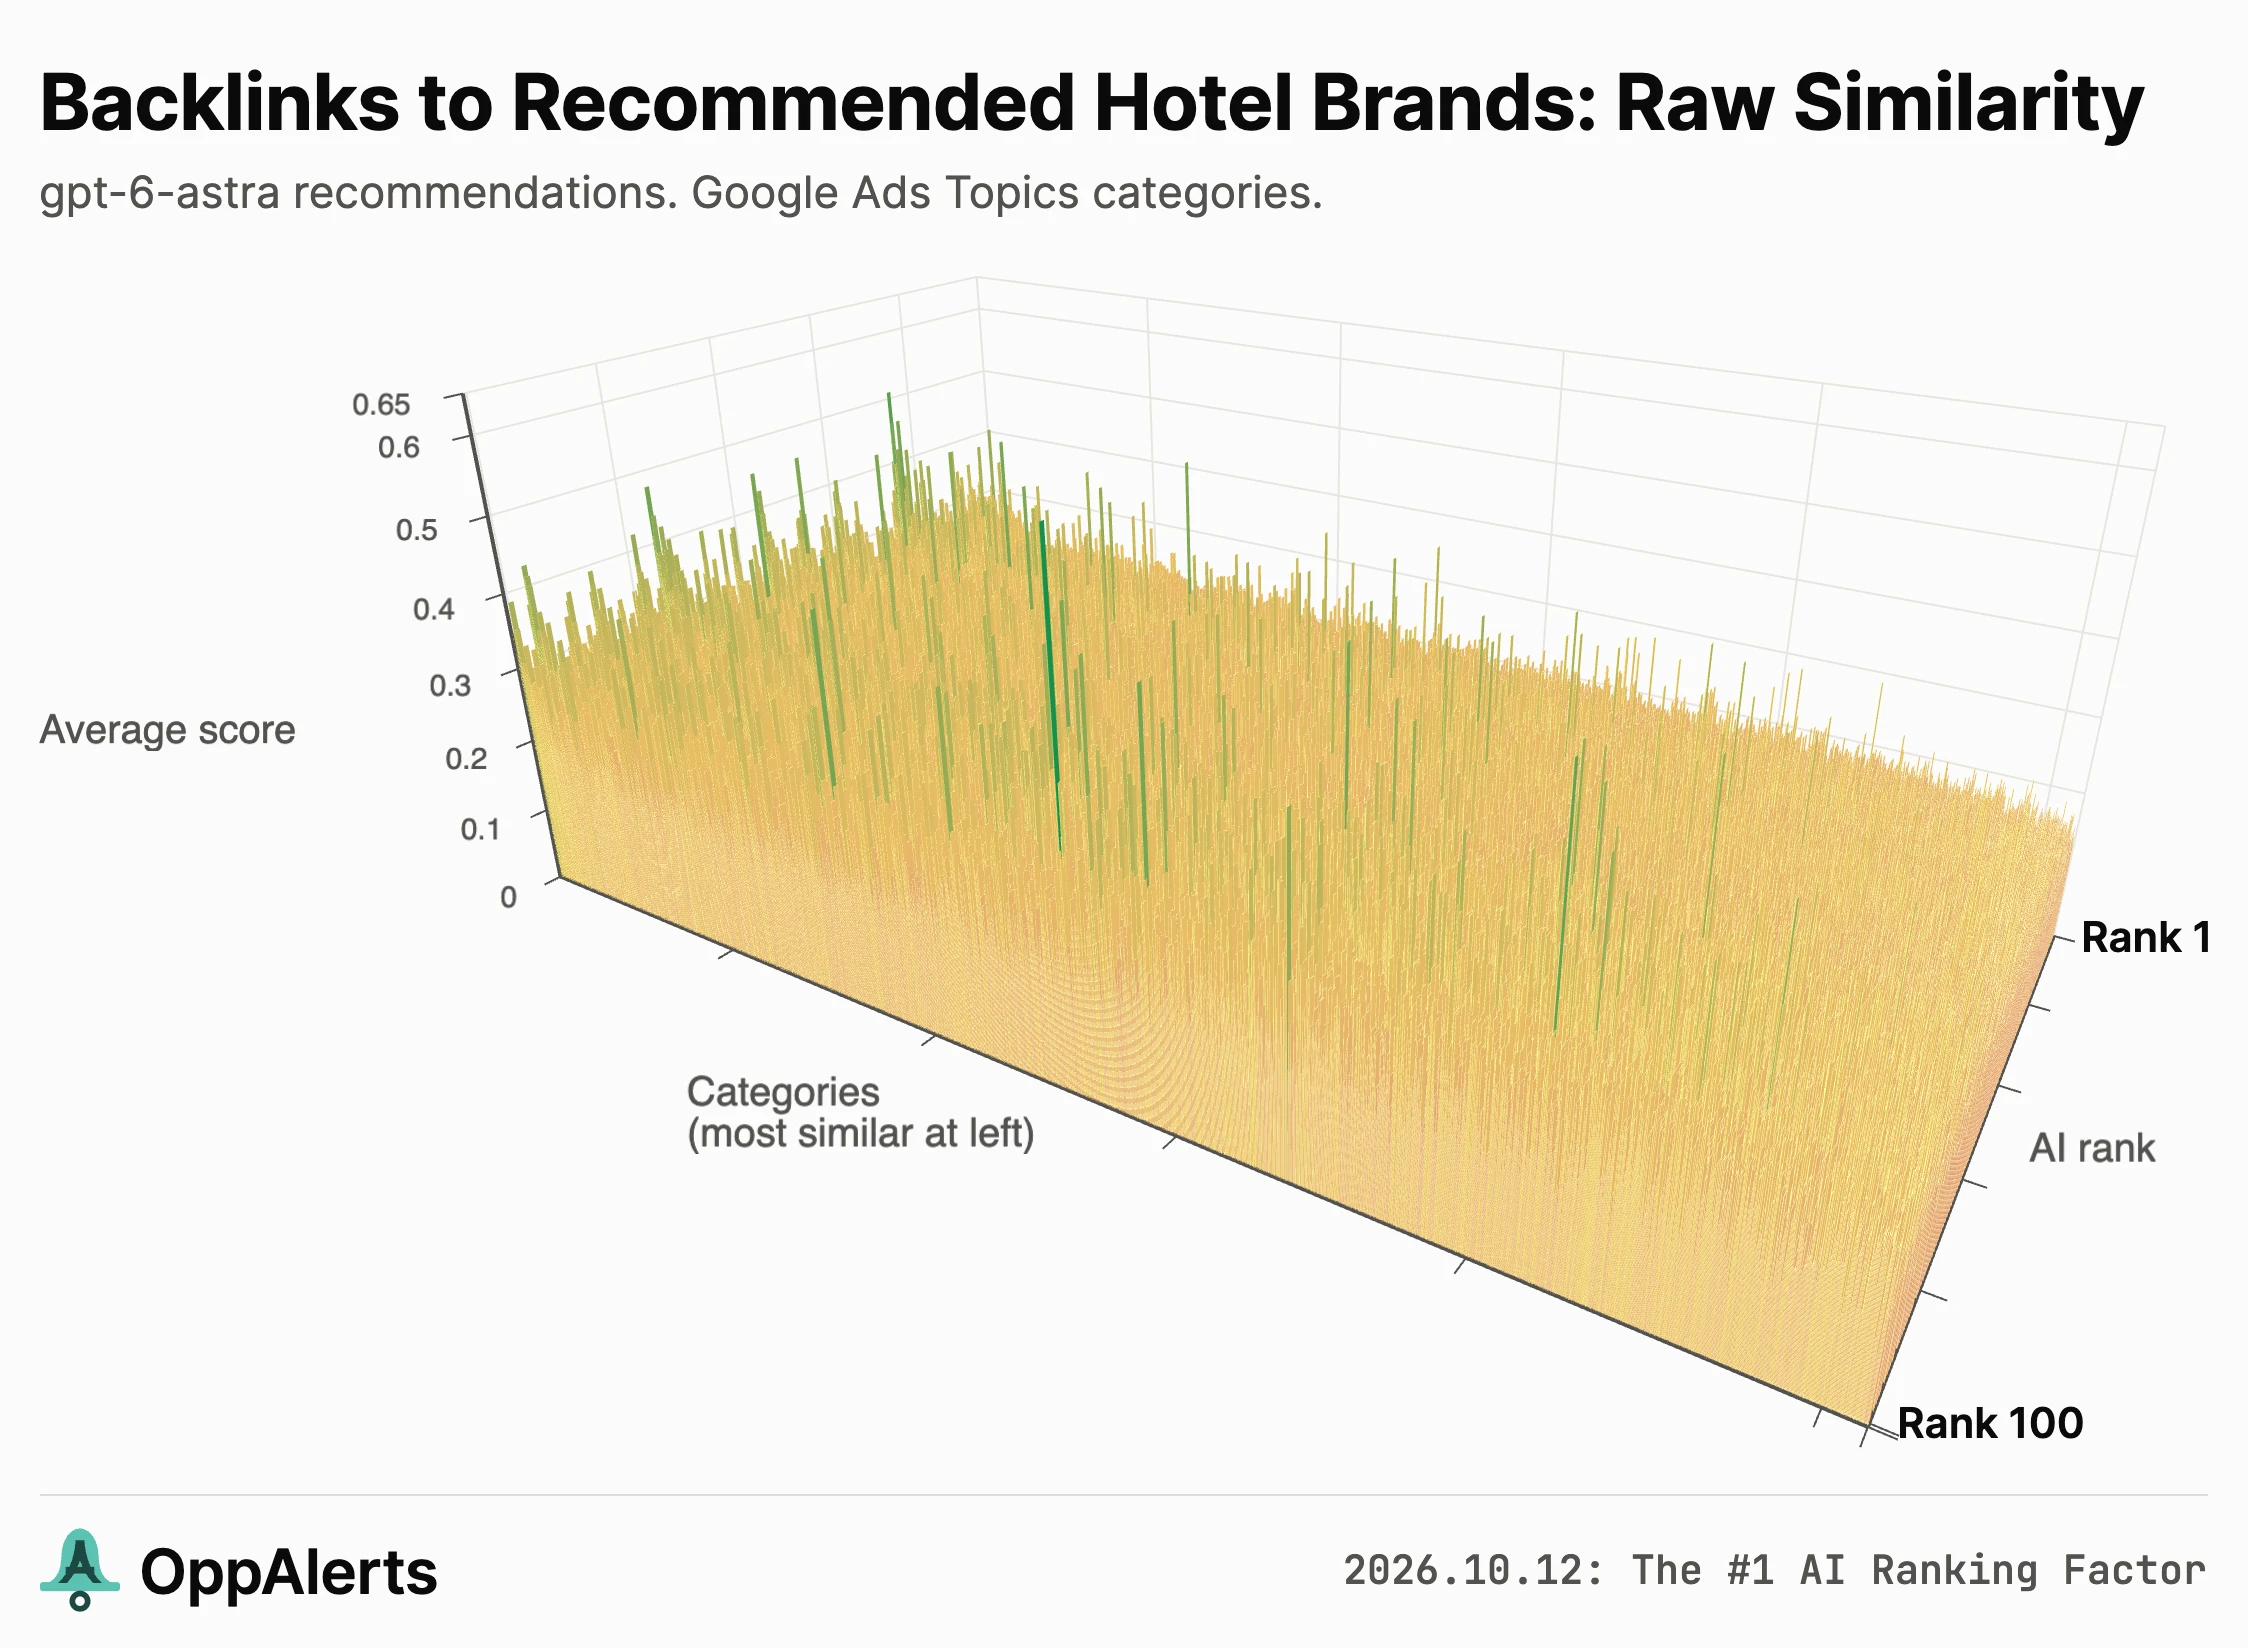
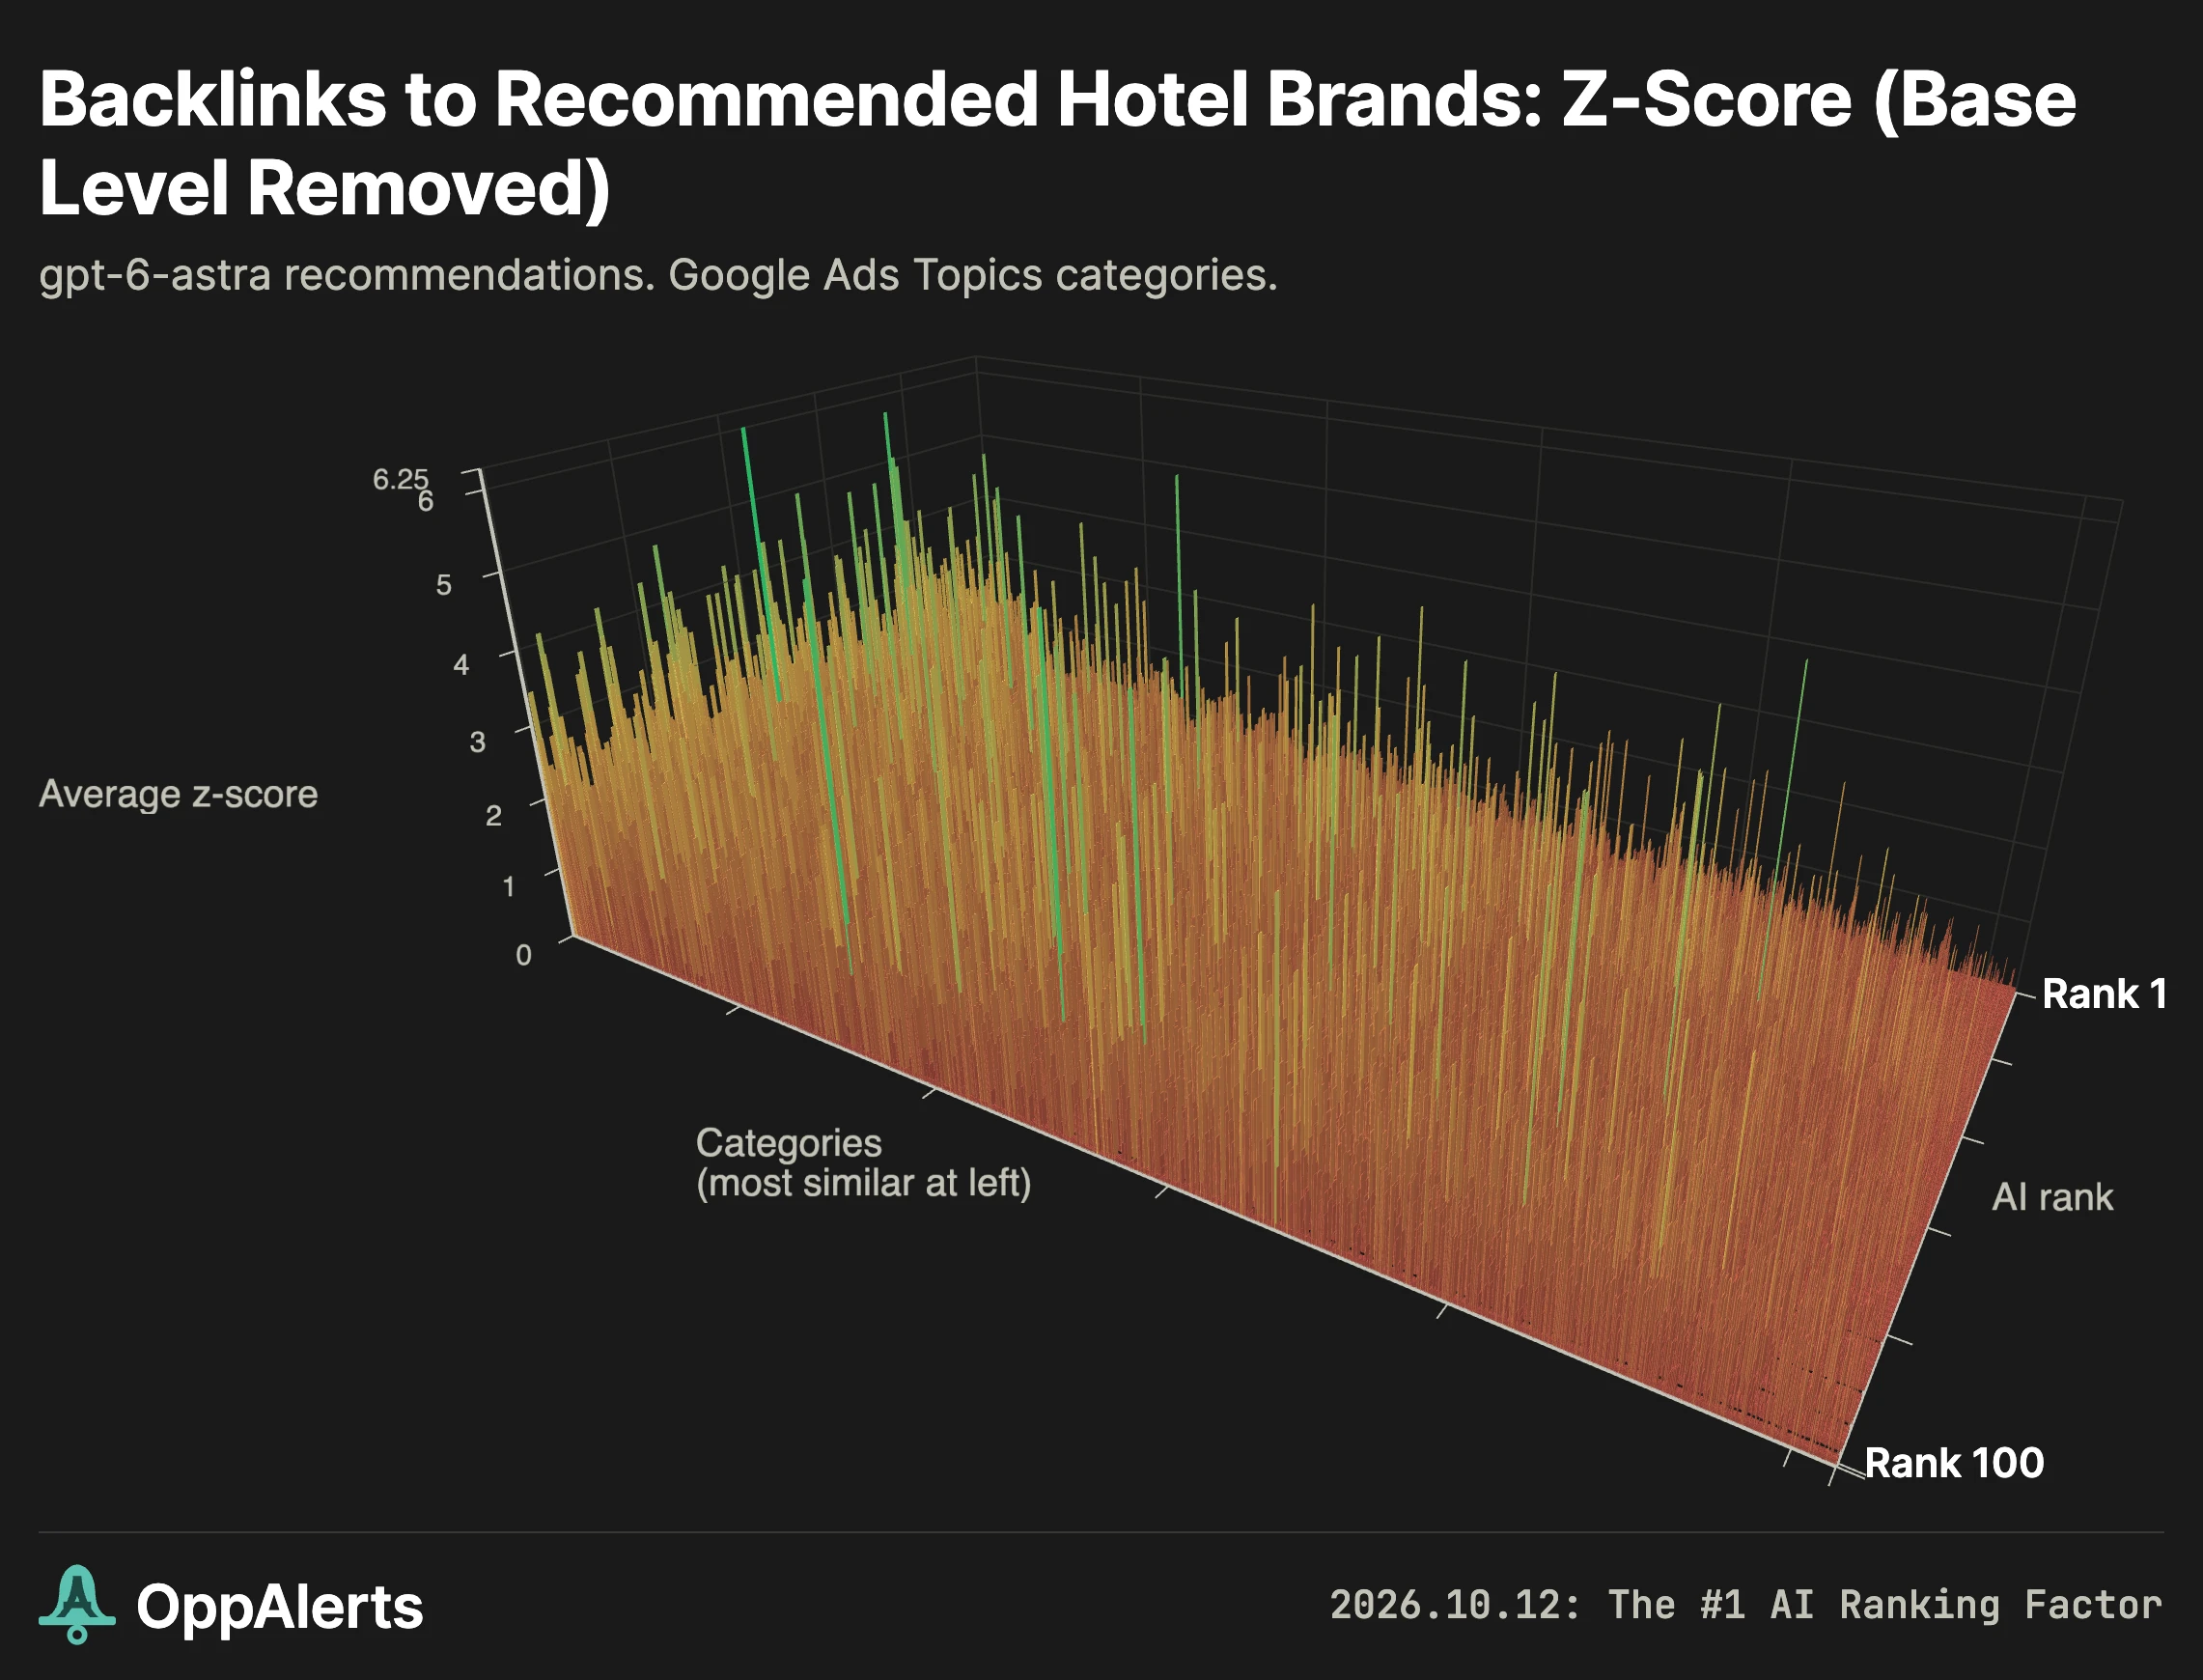
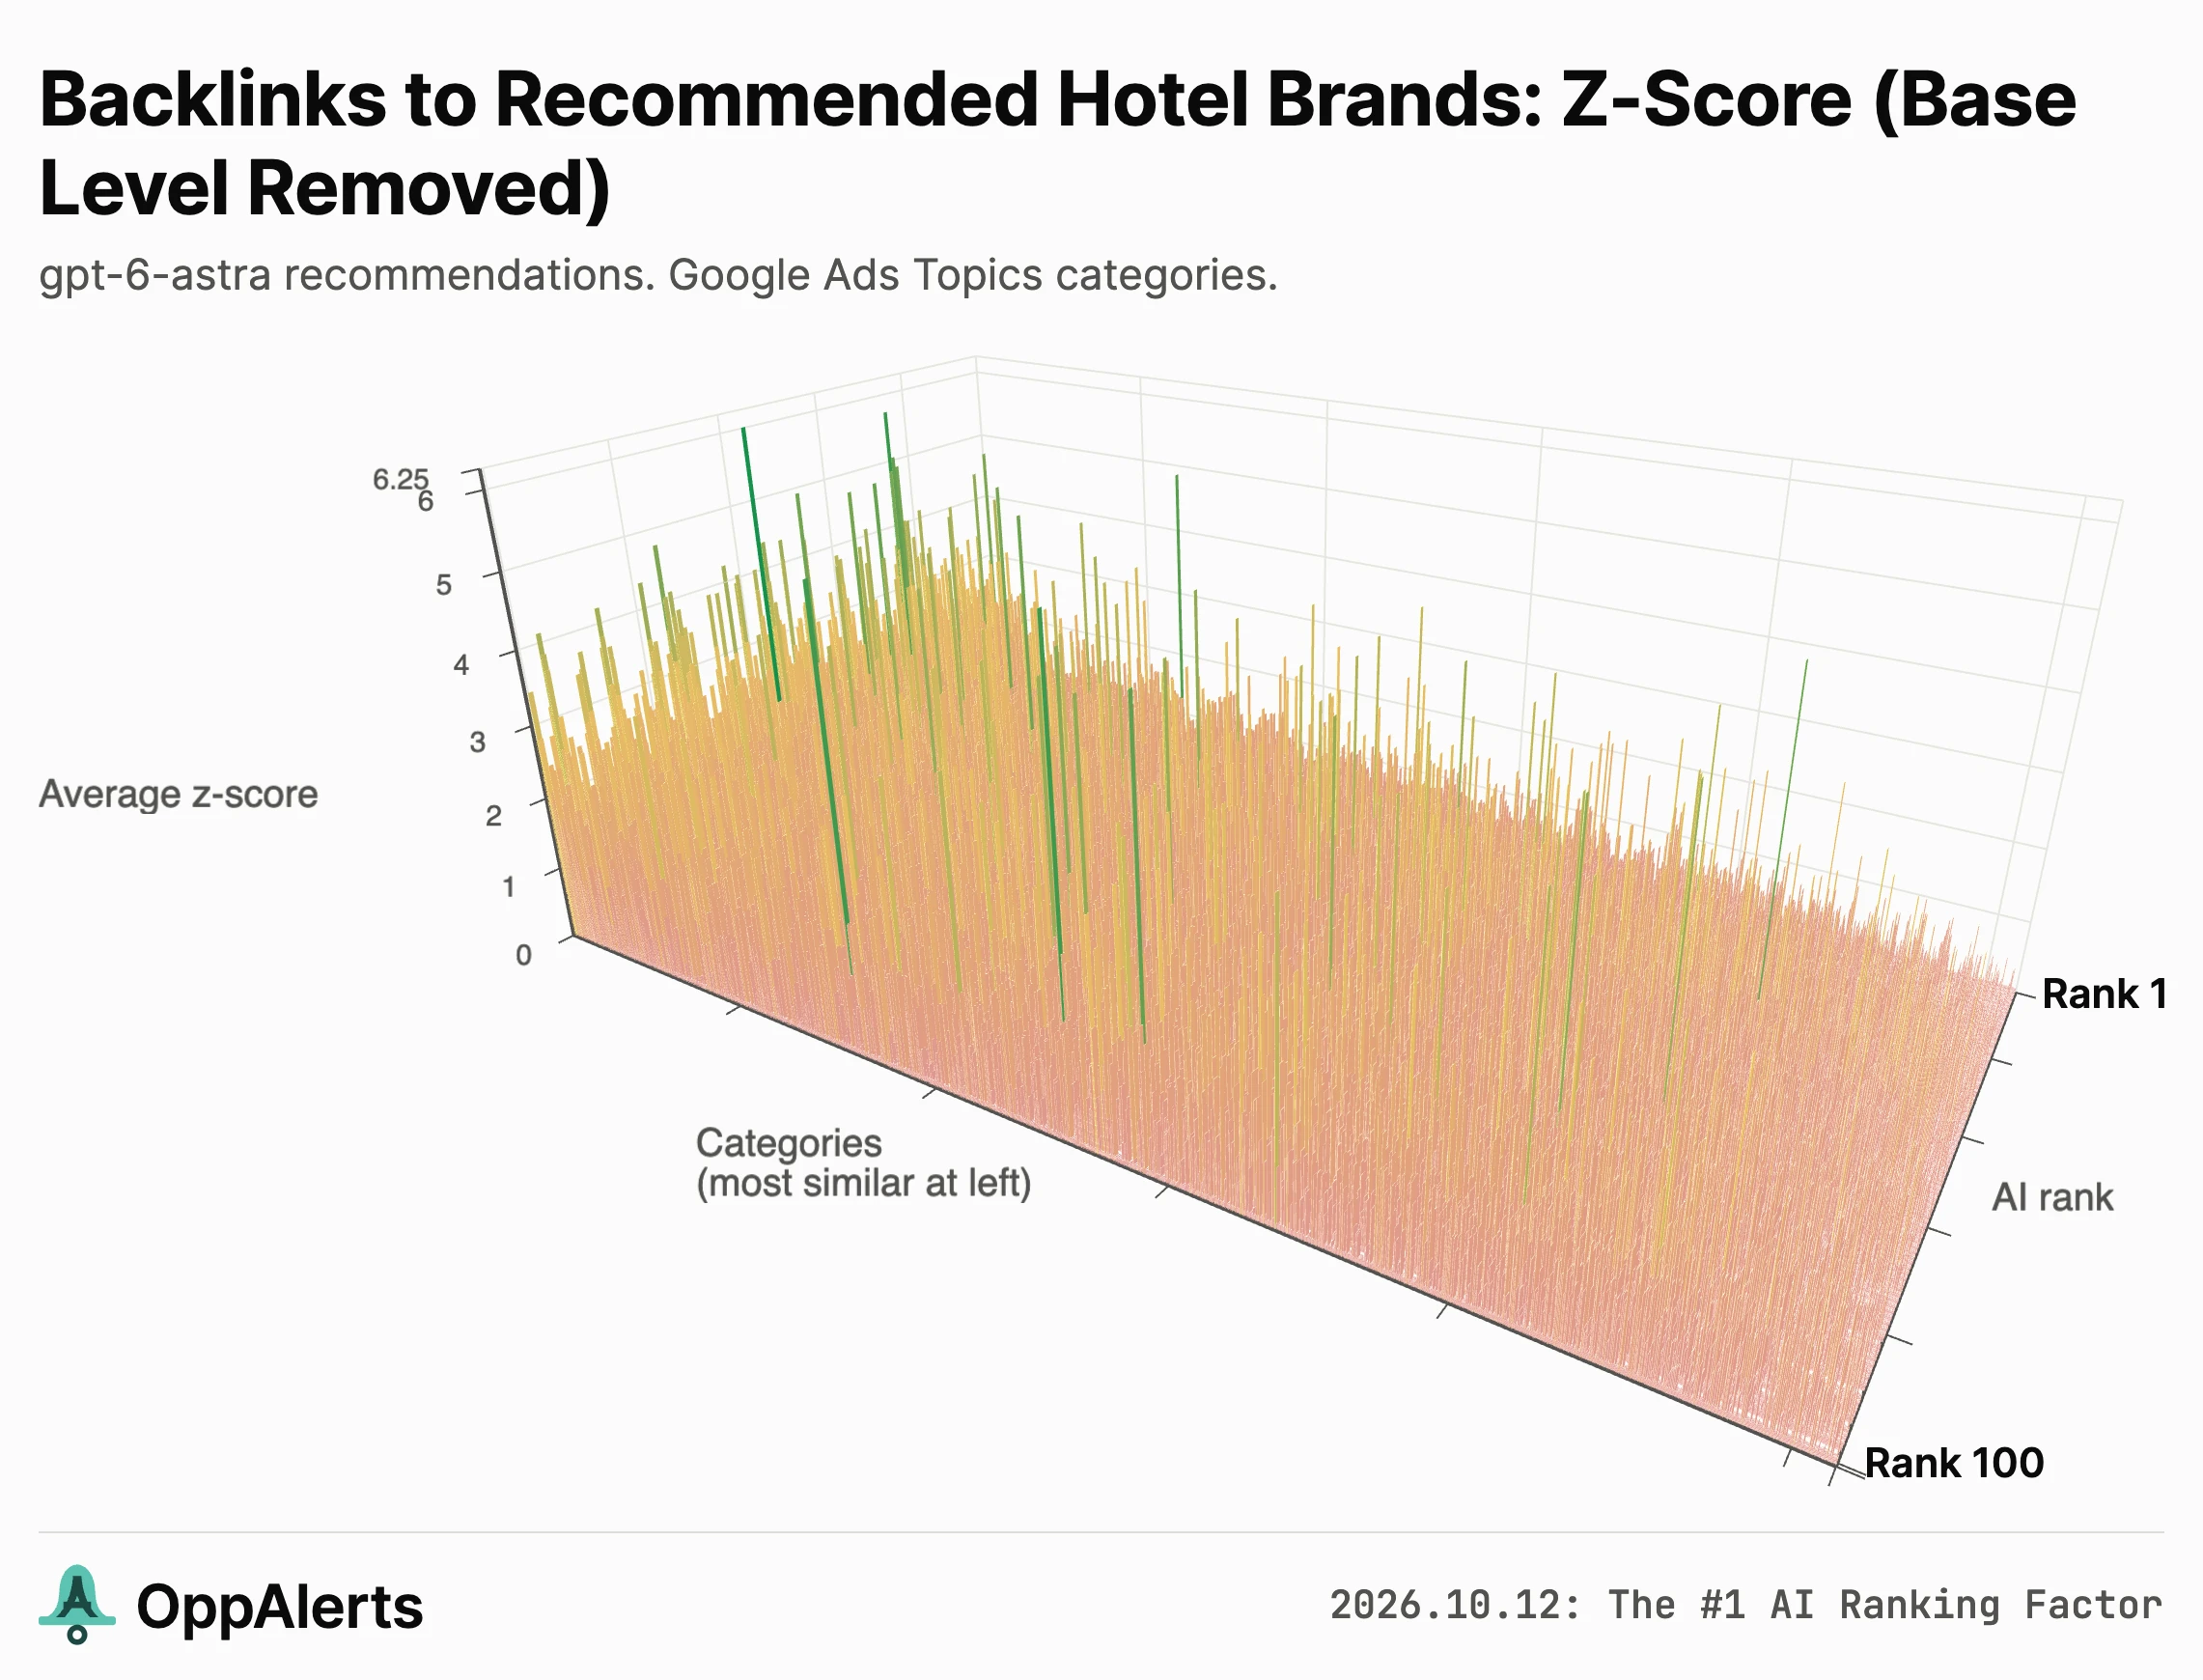
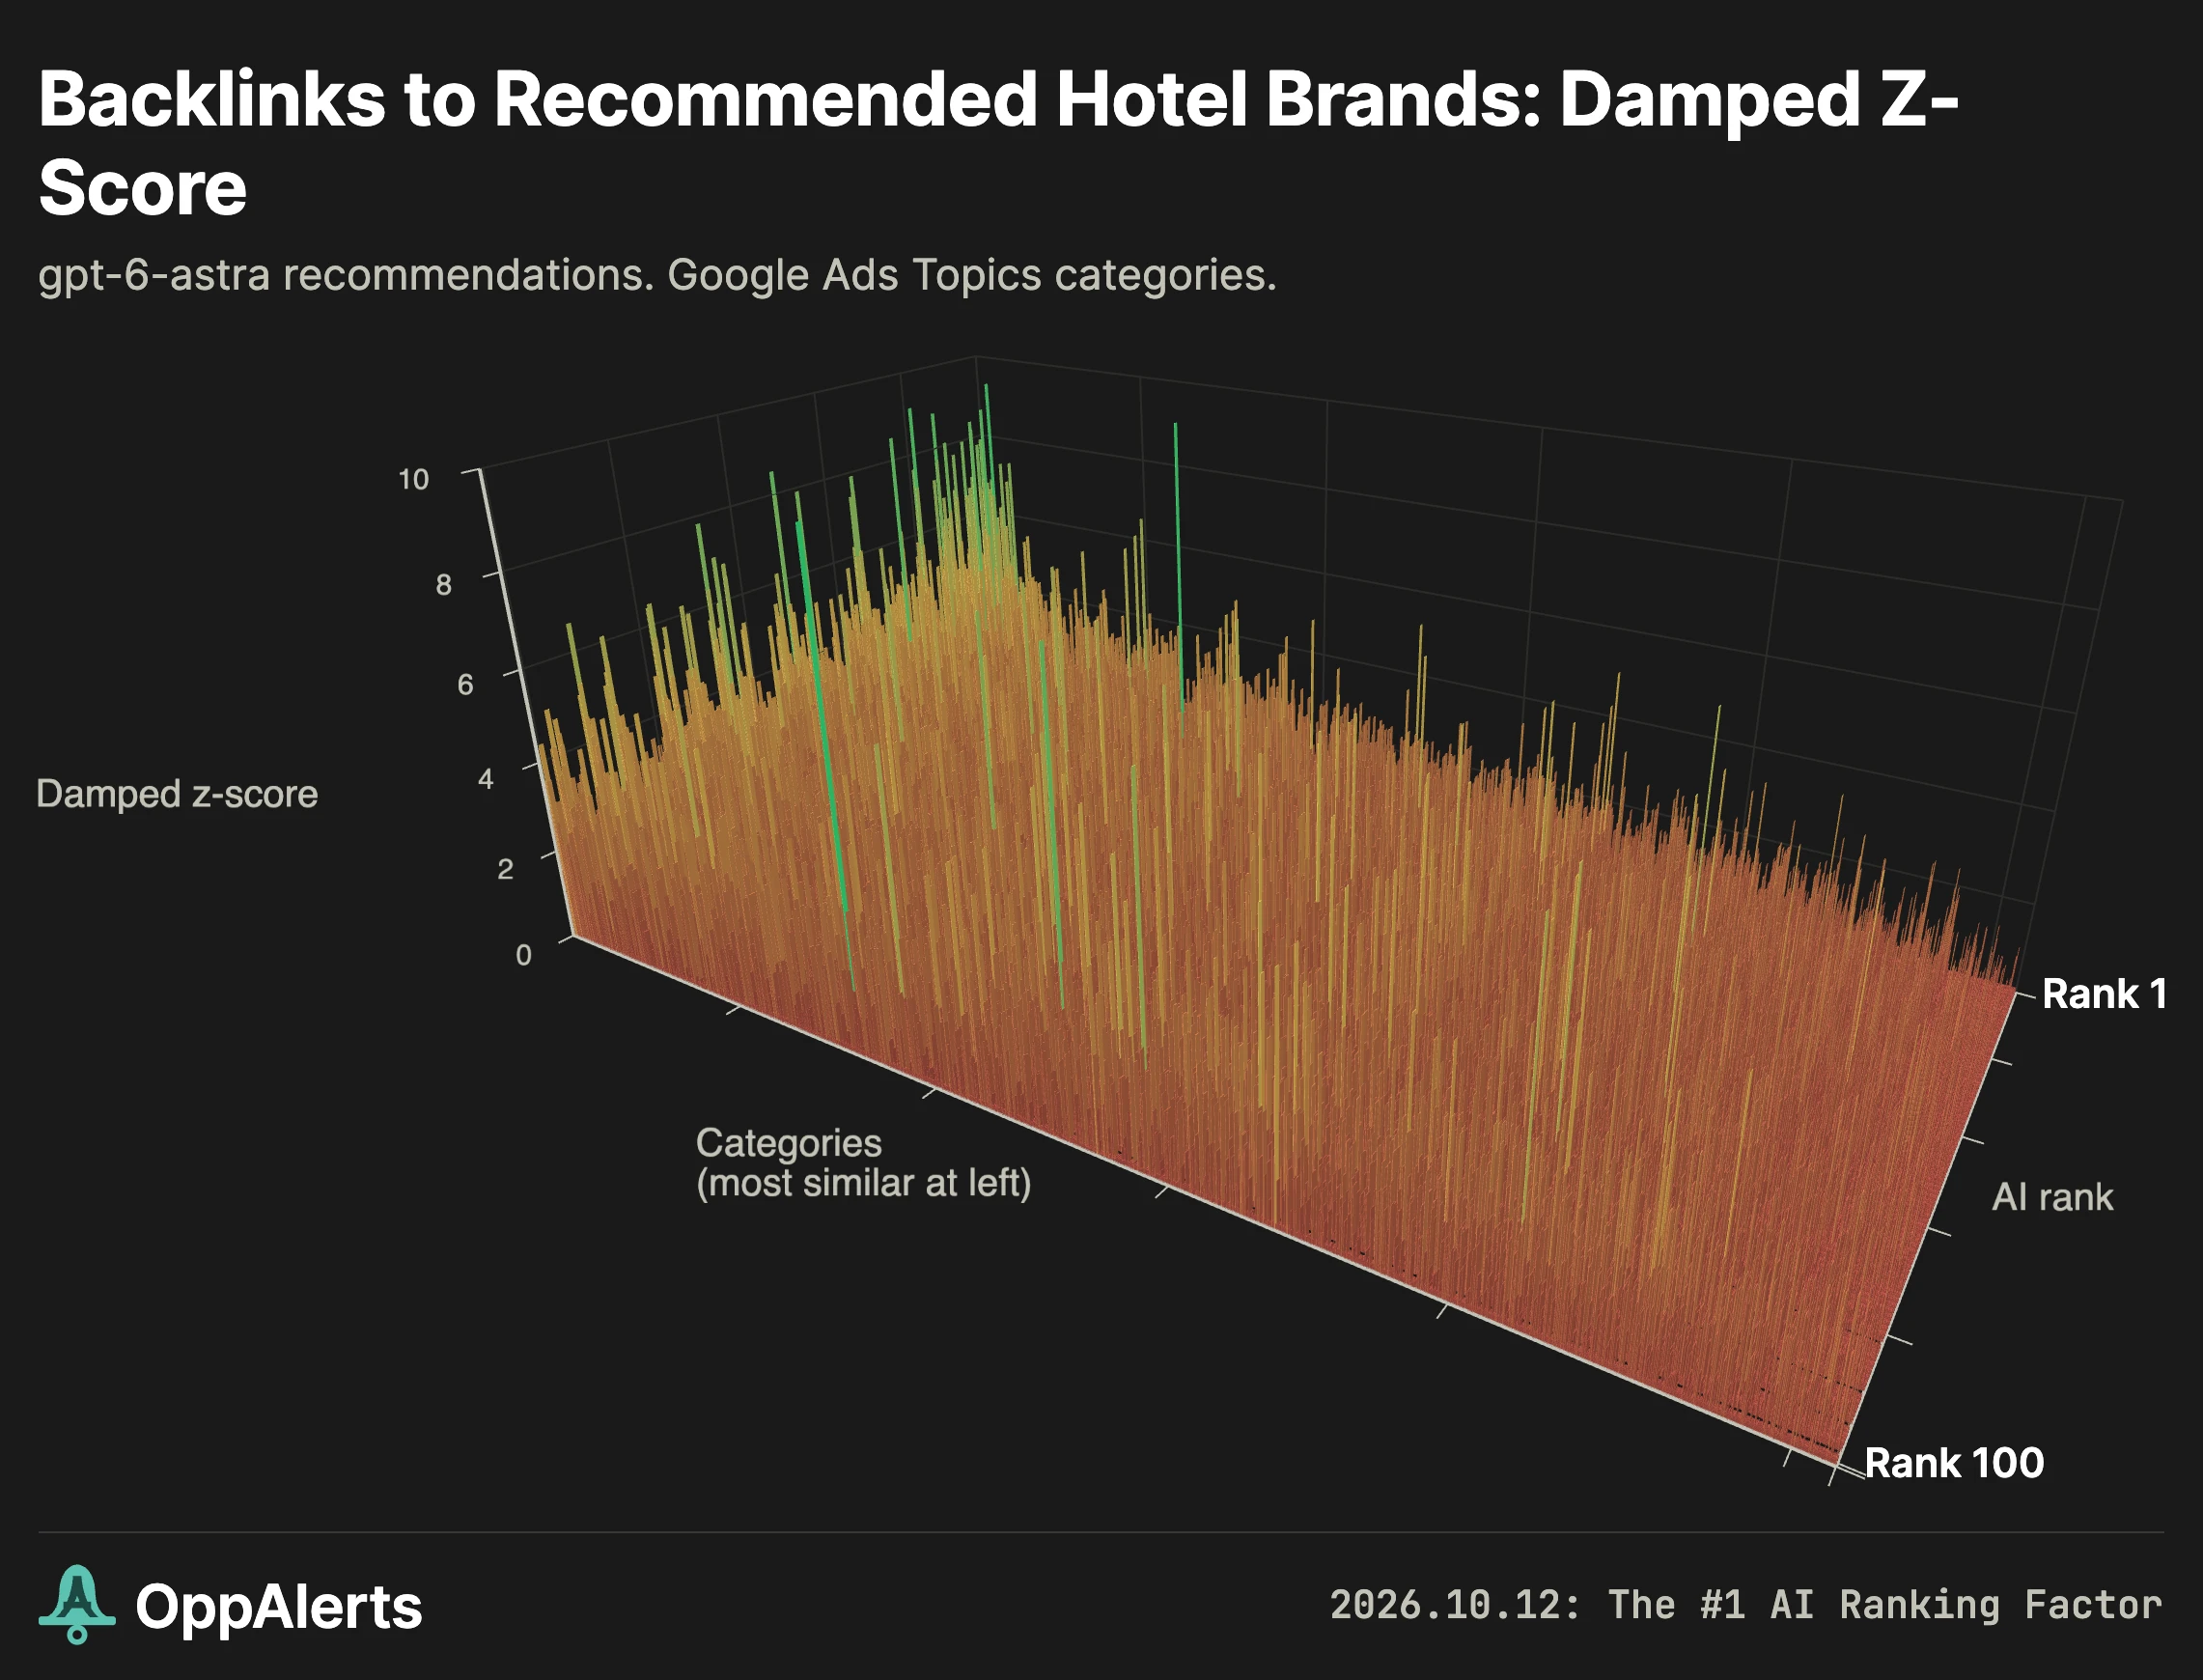
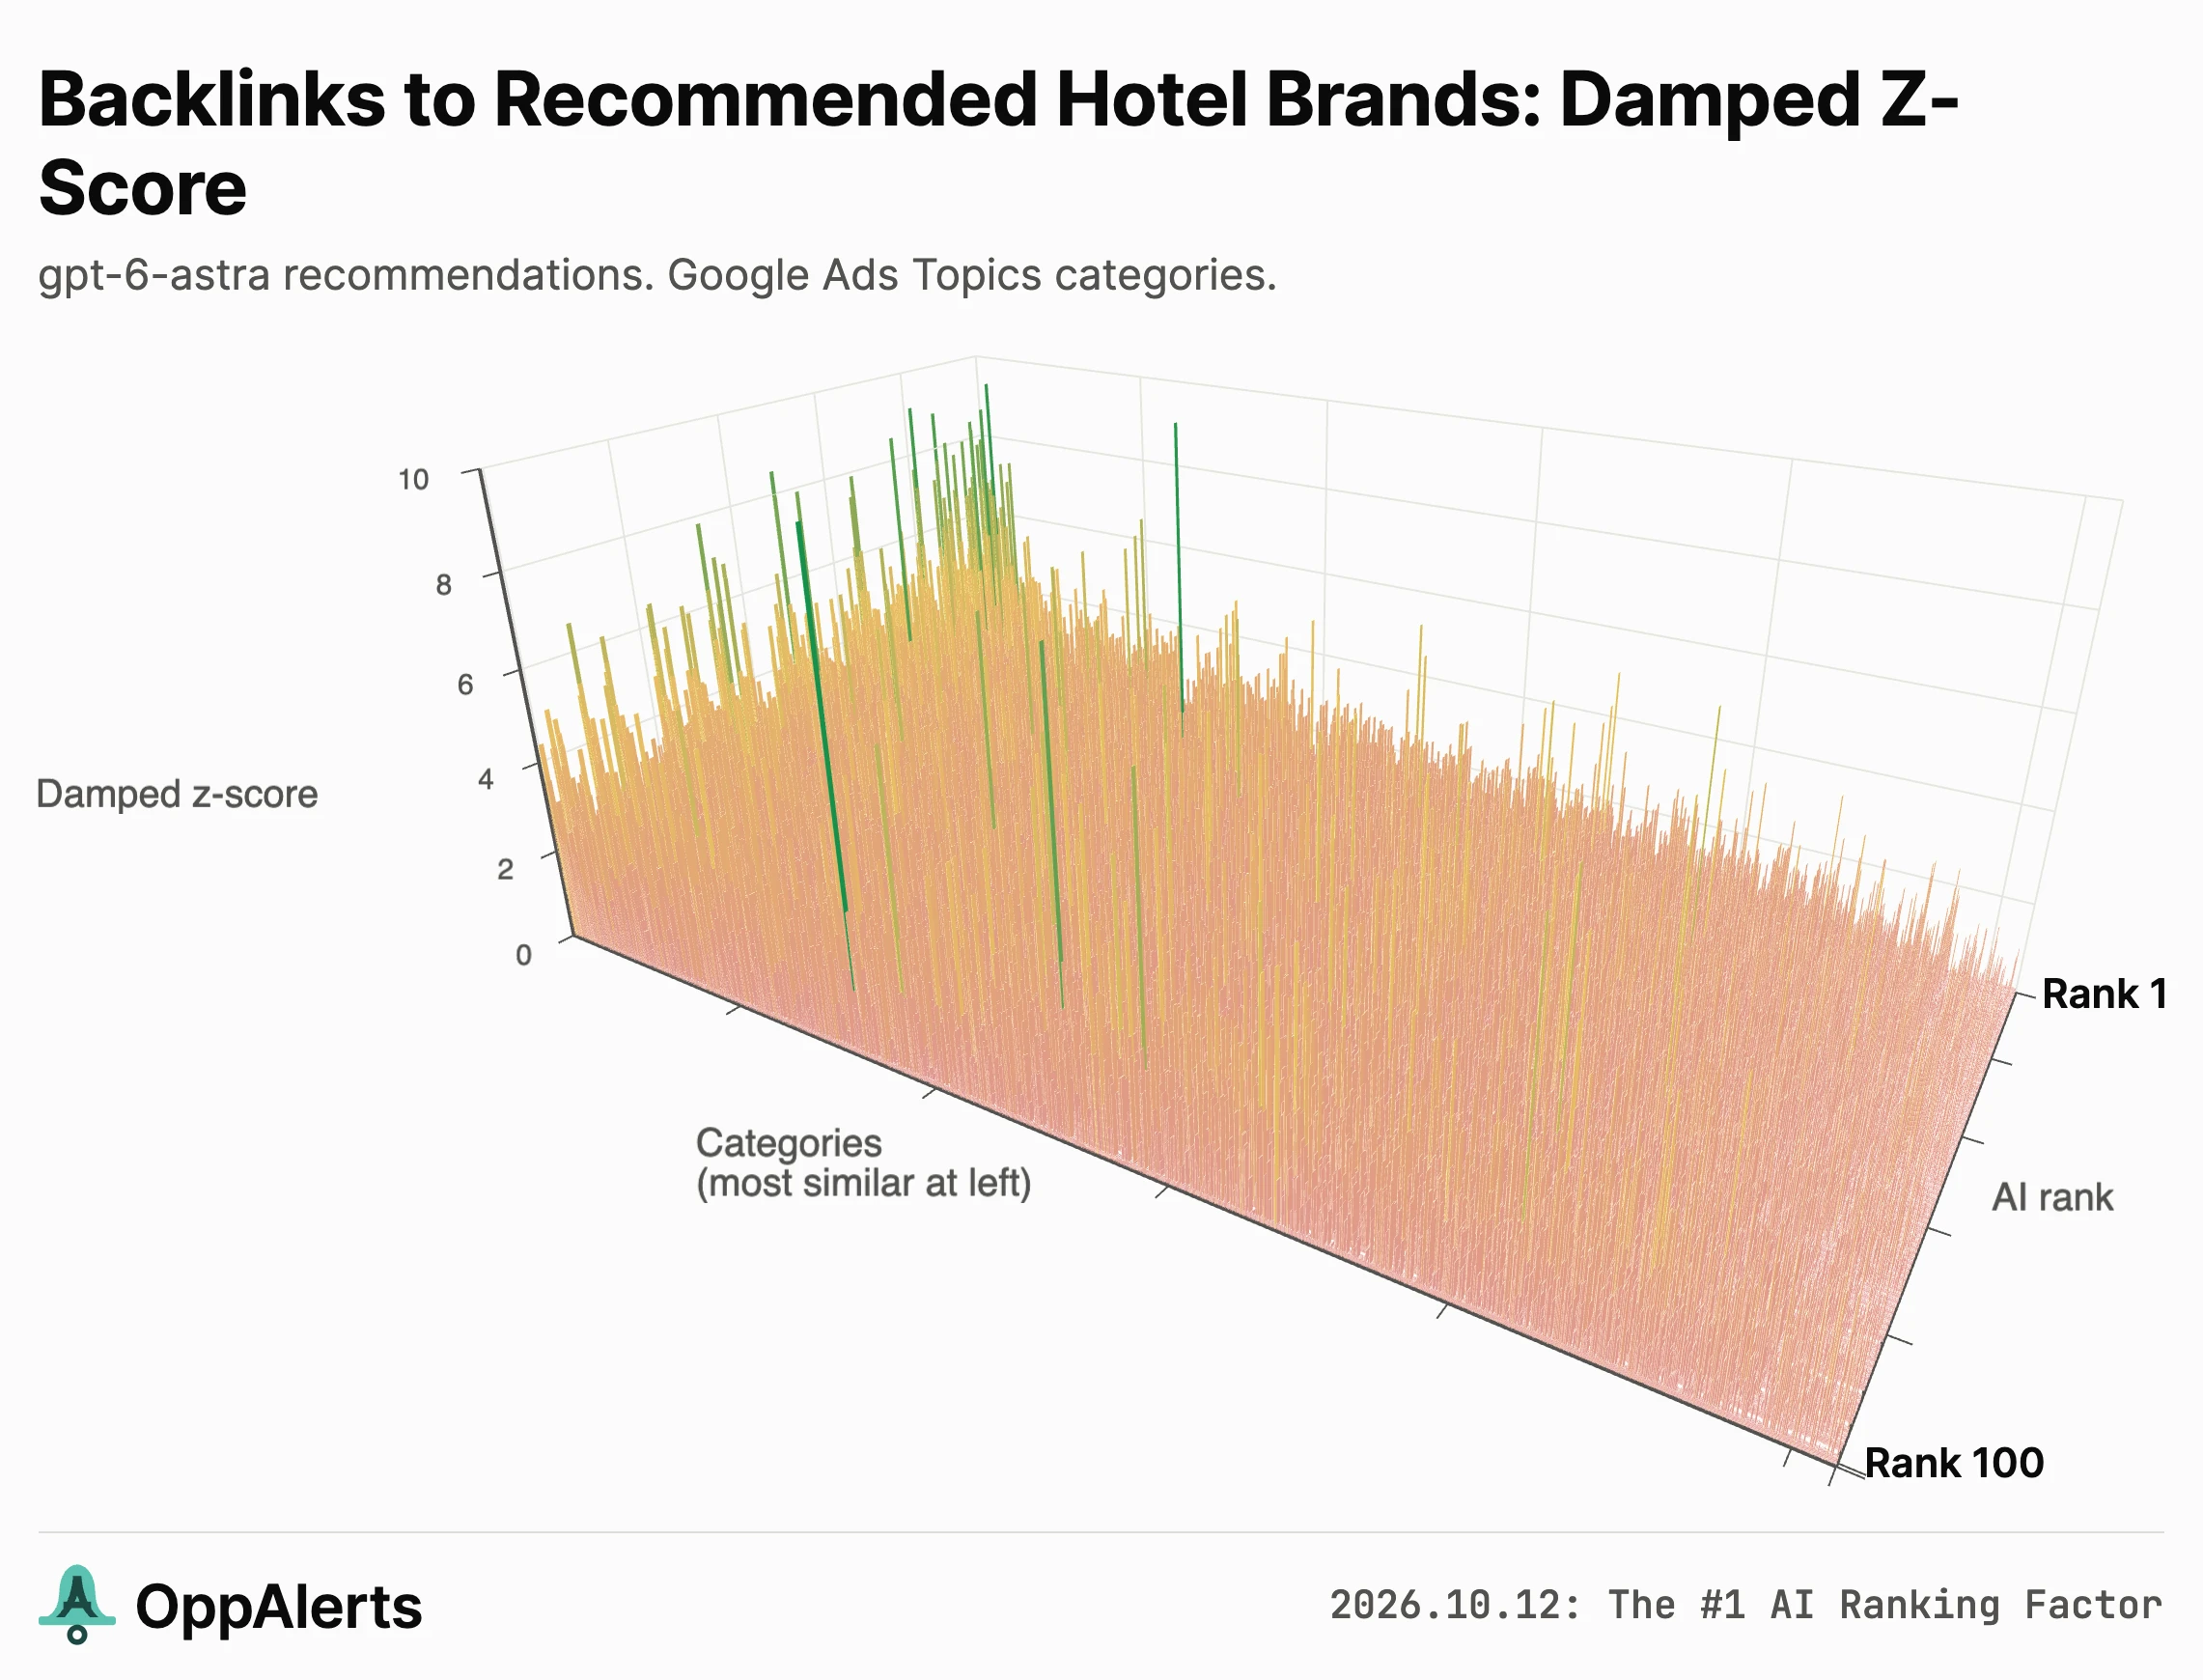
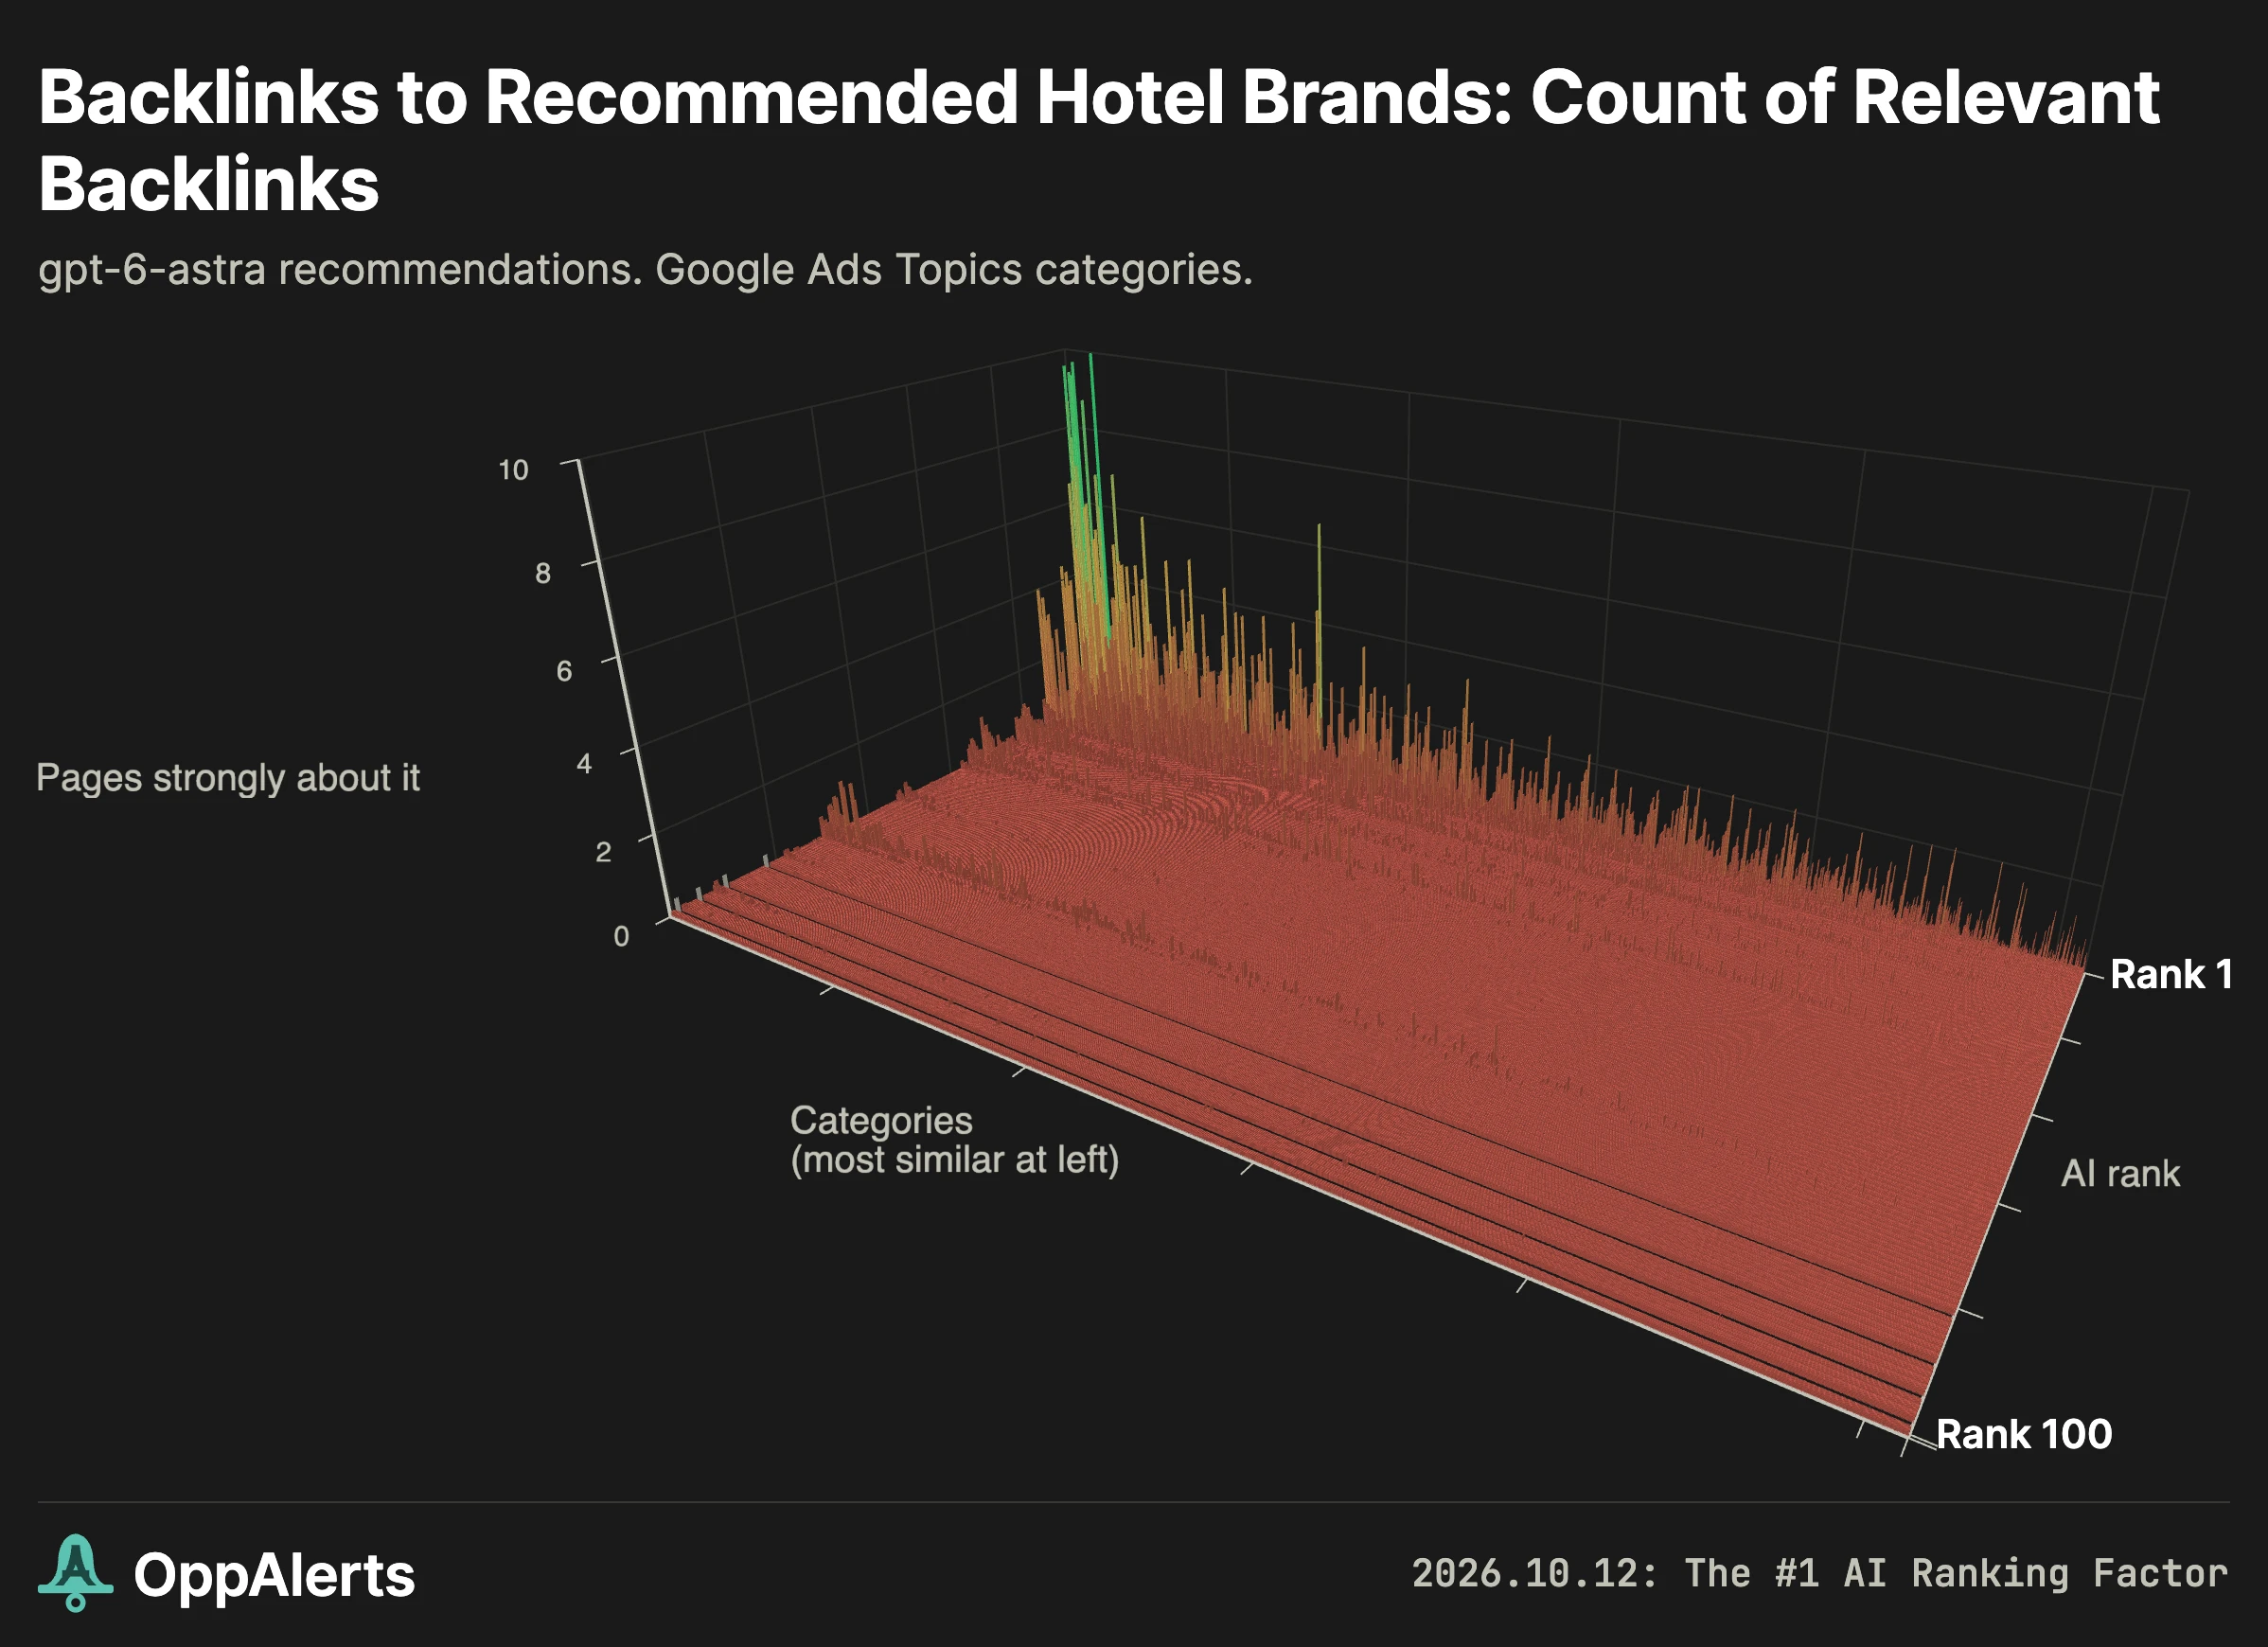
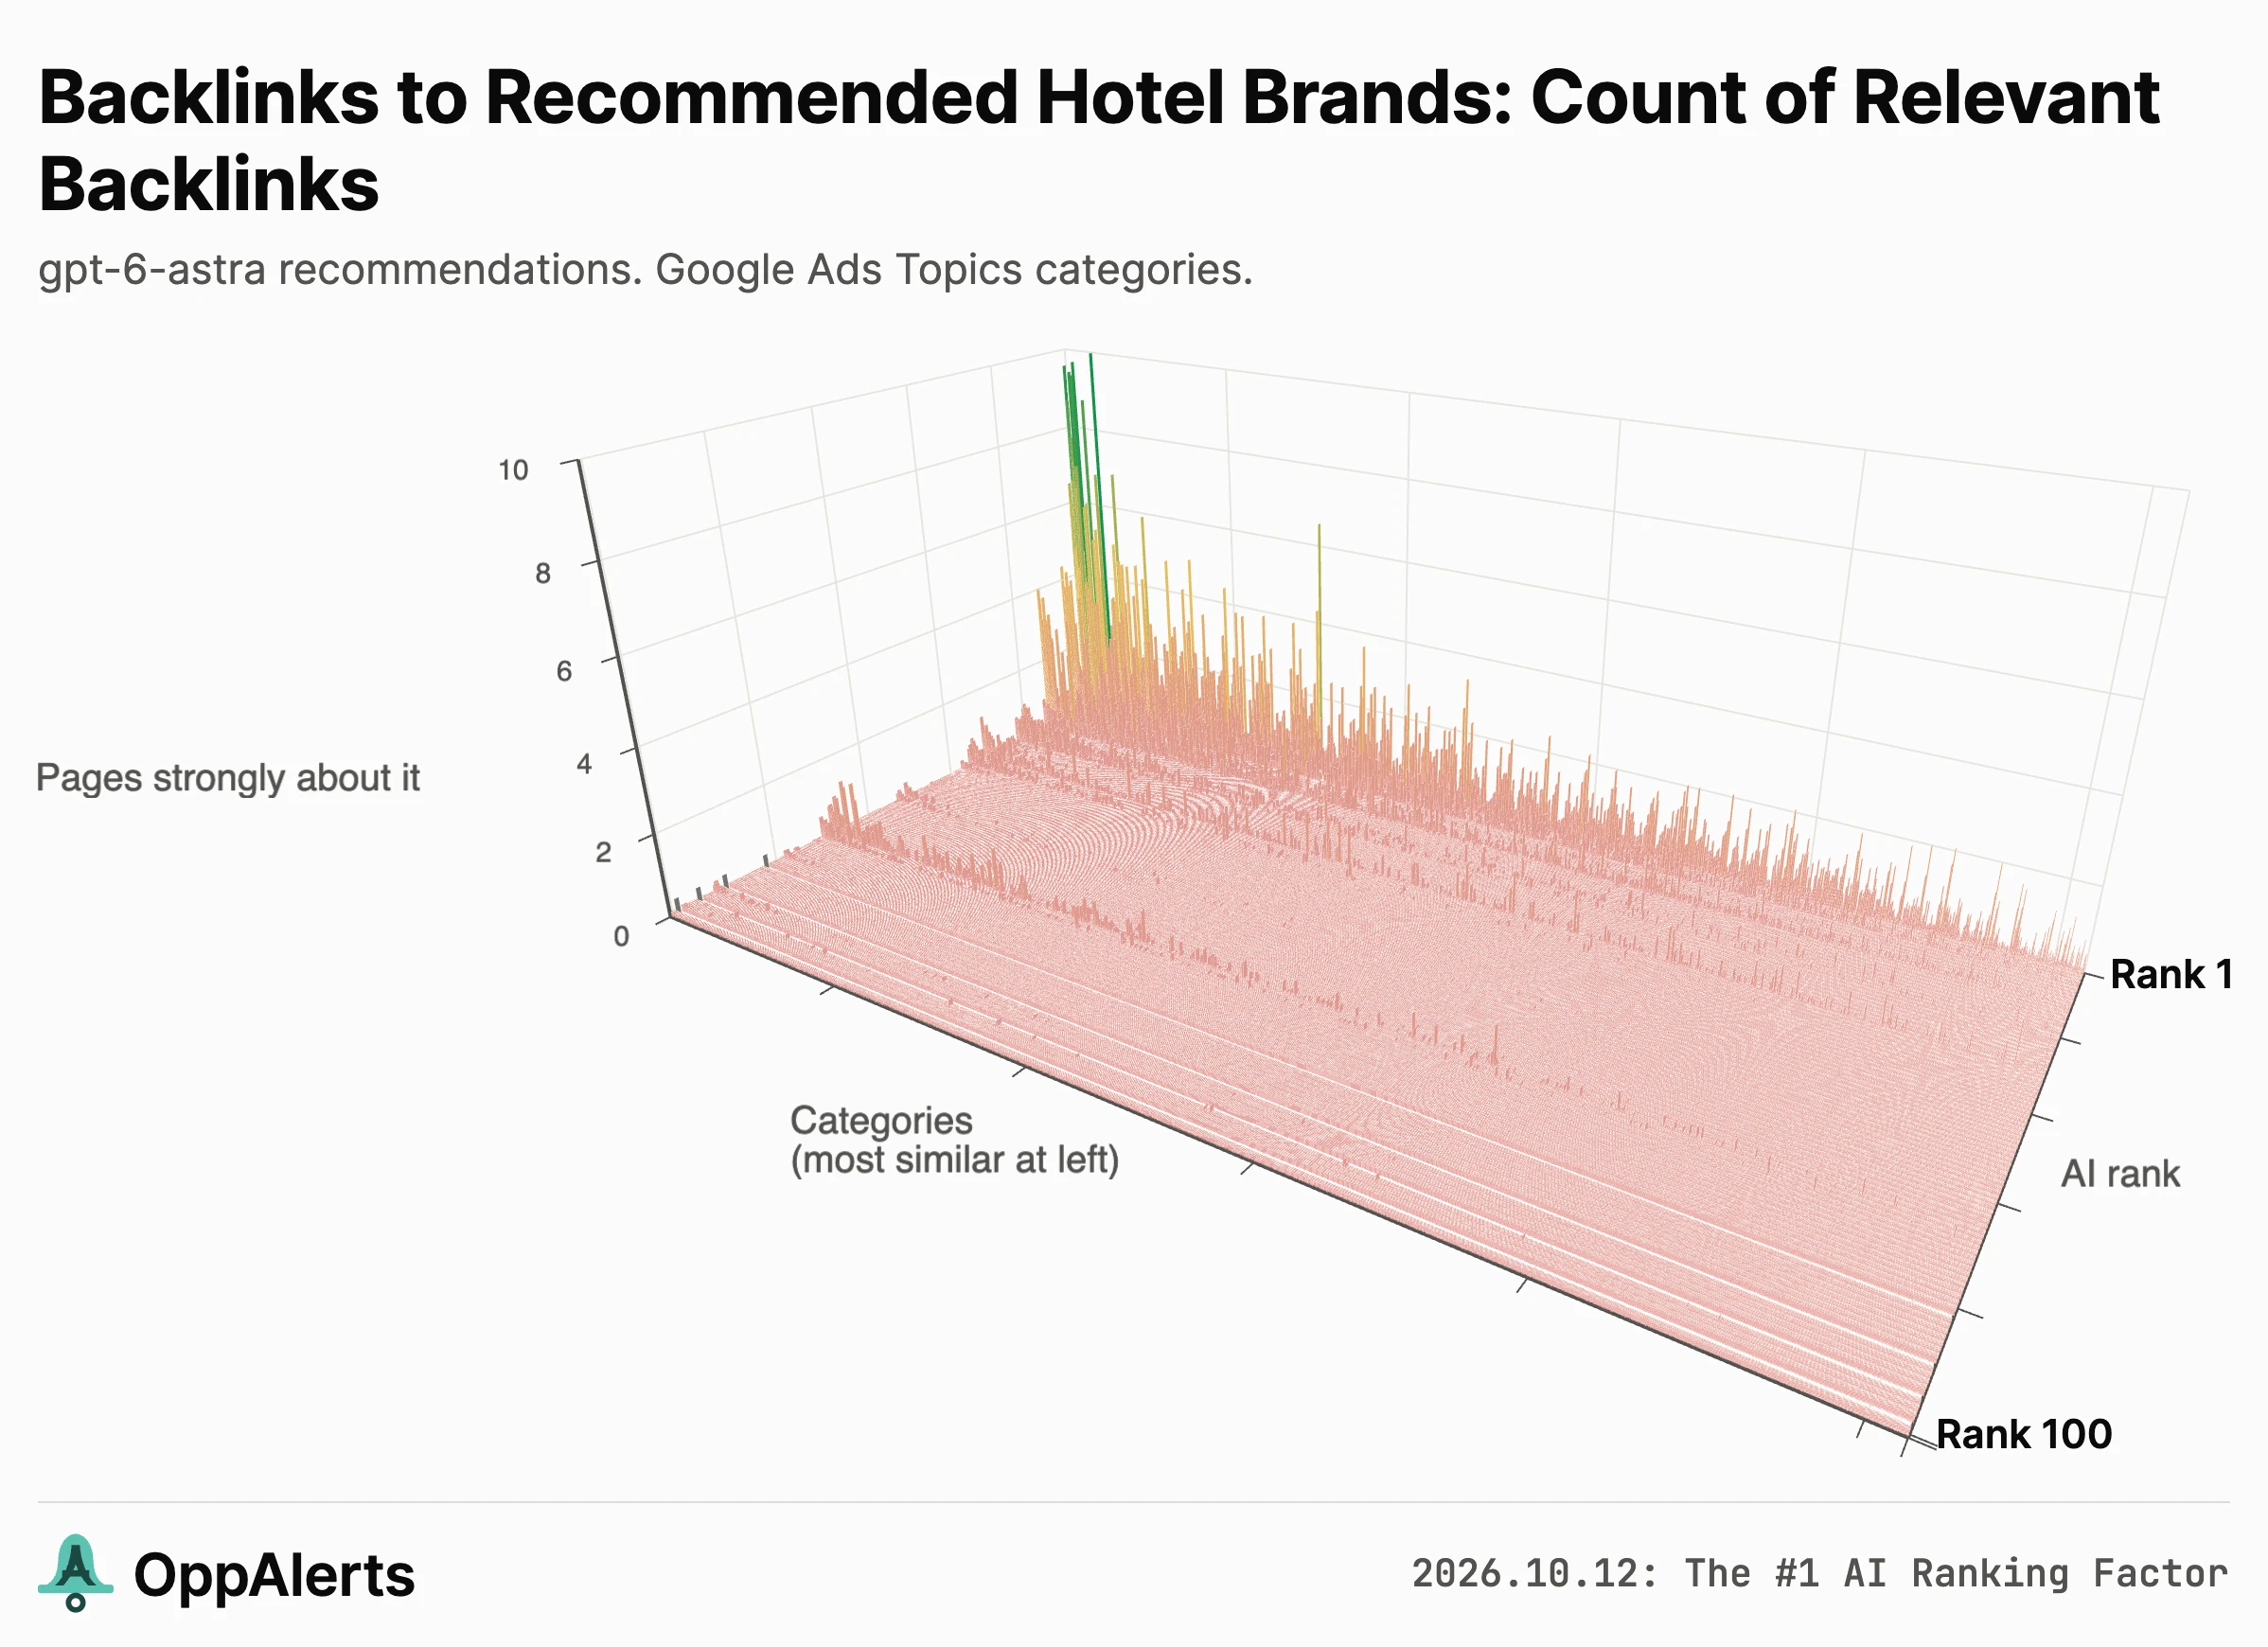
The broad pattern remains in all four: the scores are higher for categories close to the industry and lower for less related categories.
The pattern holds across models
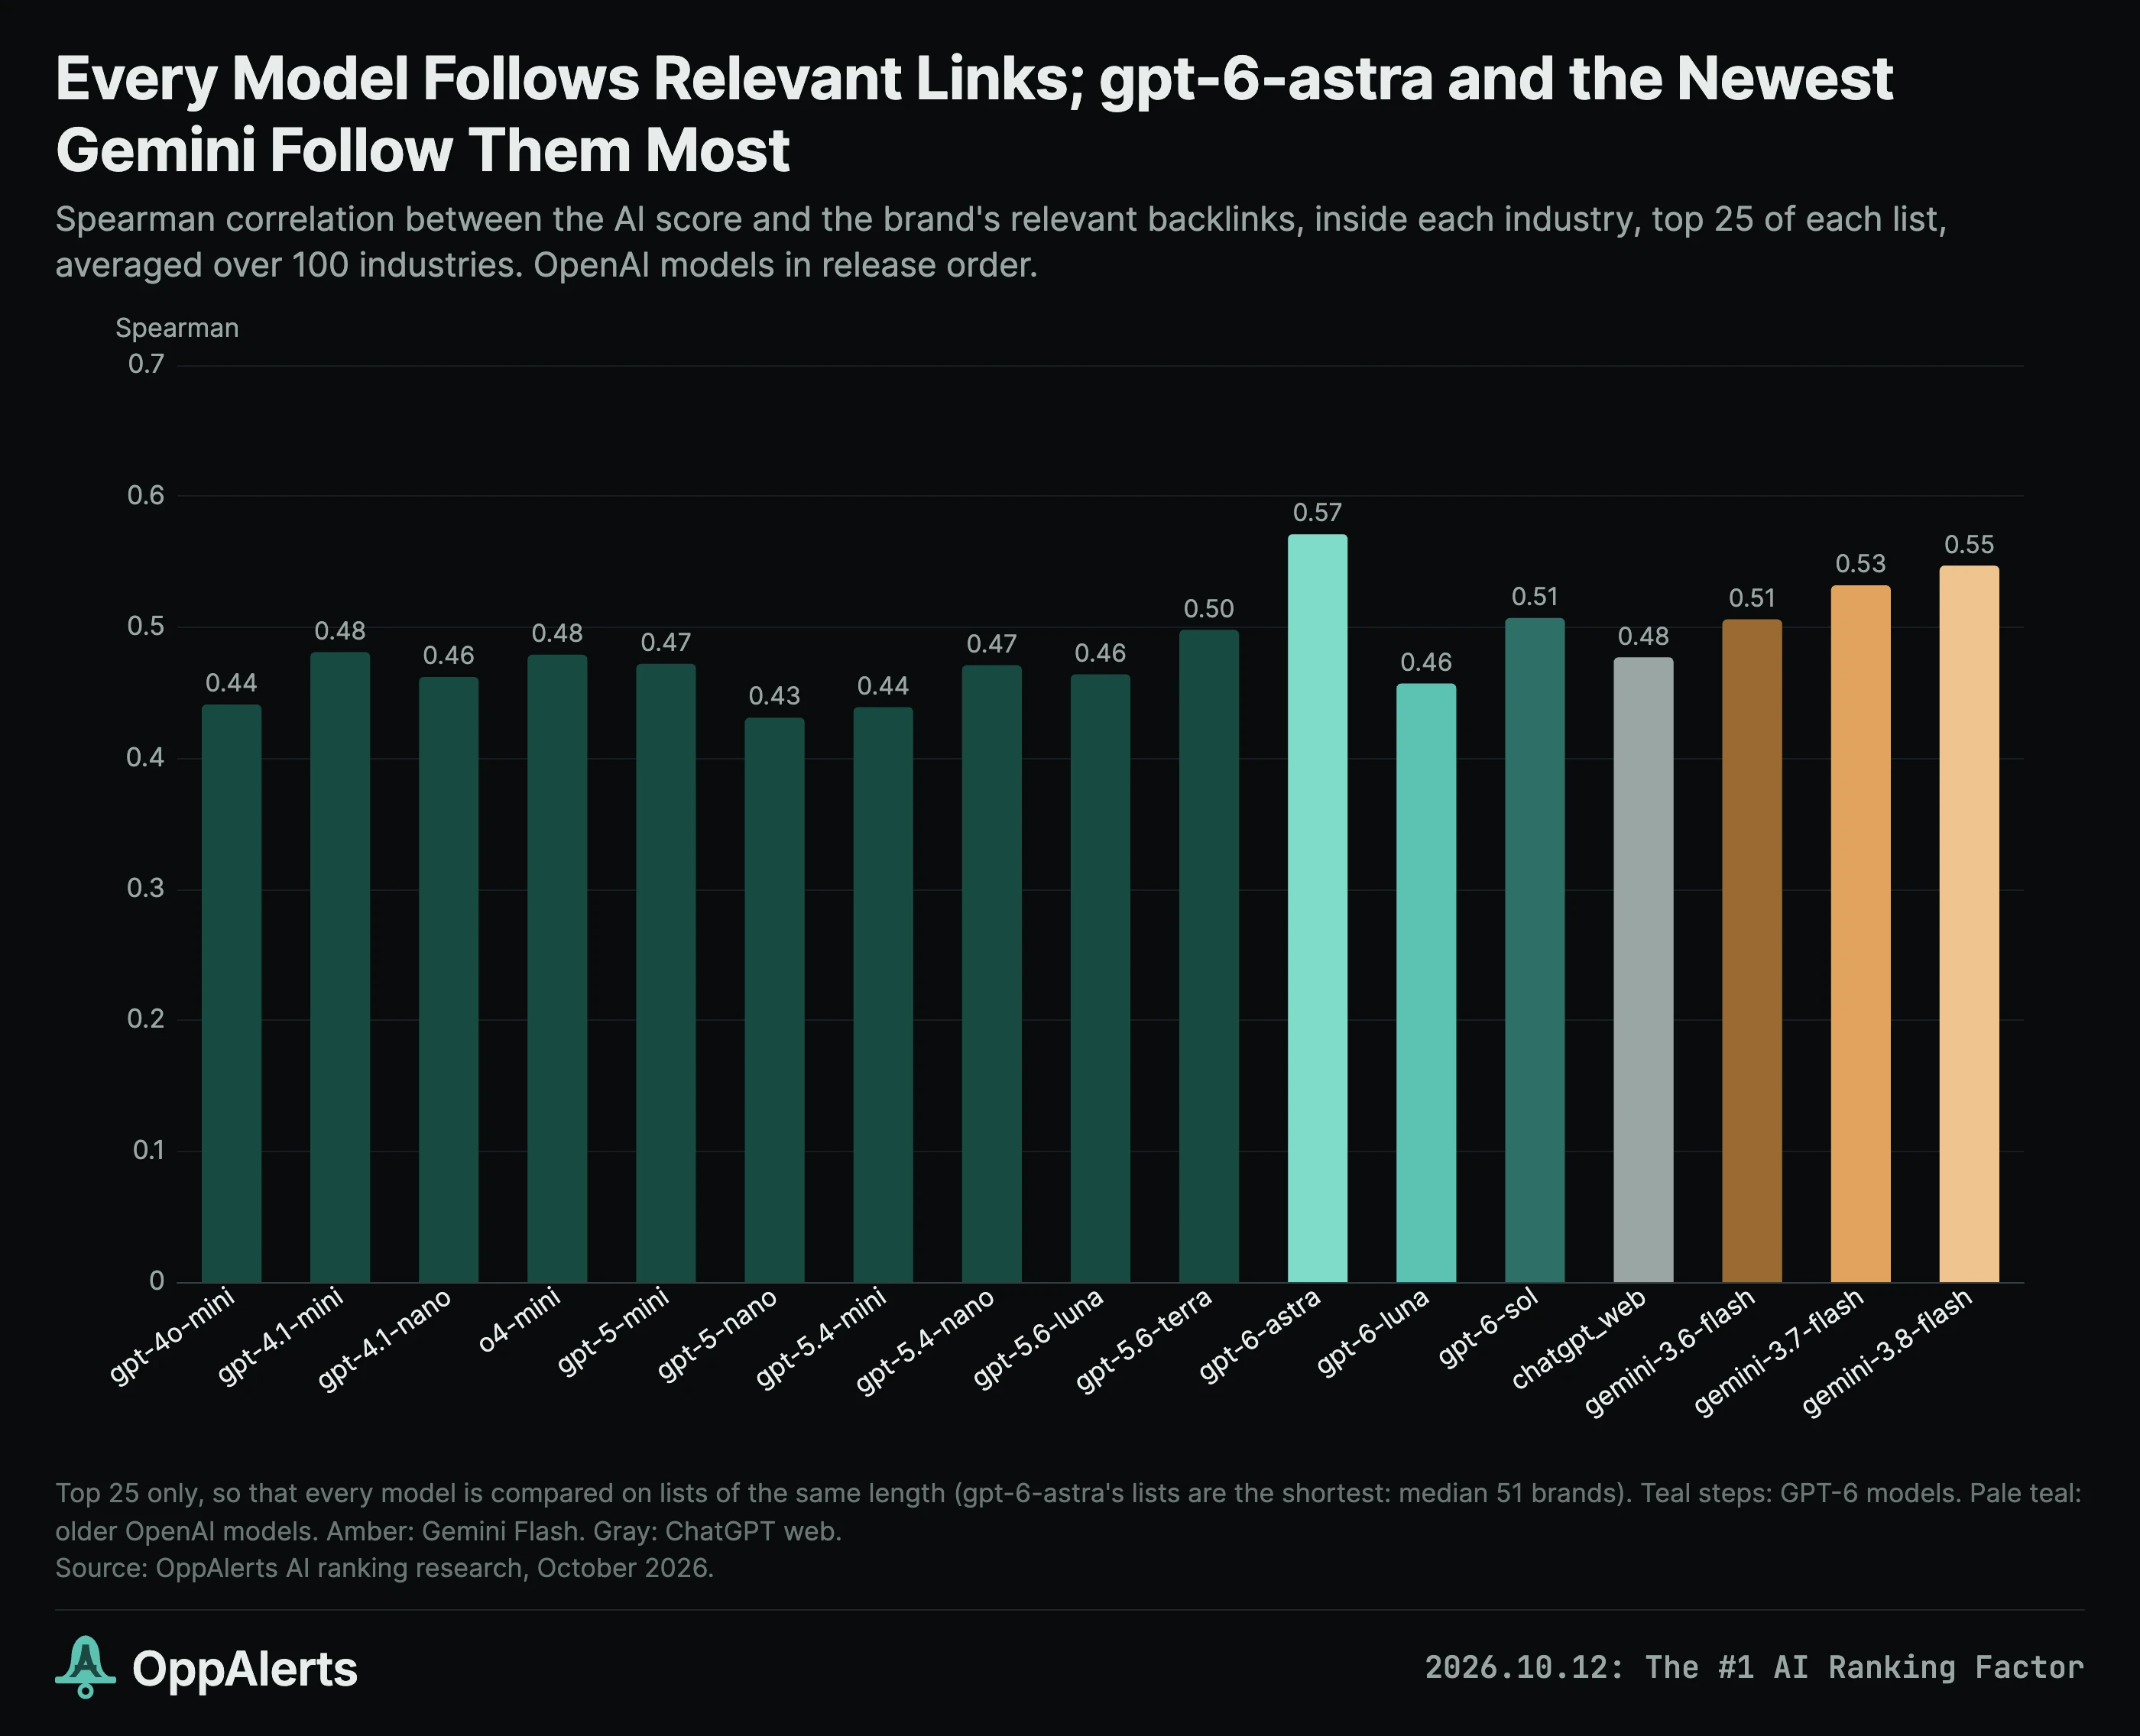
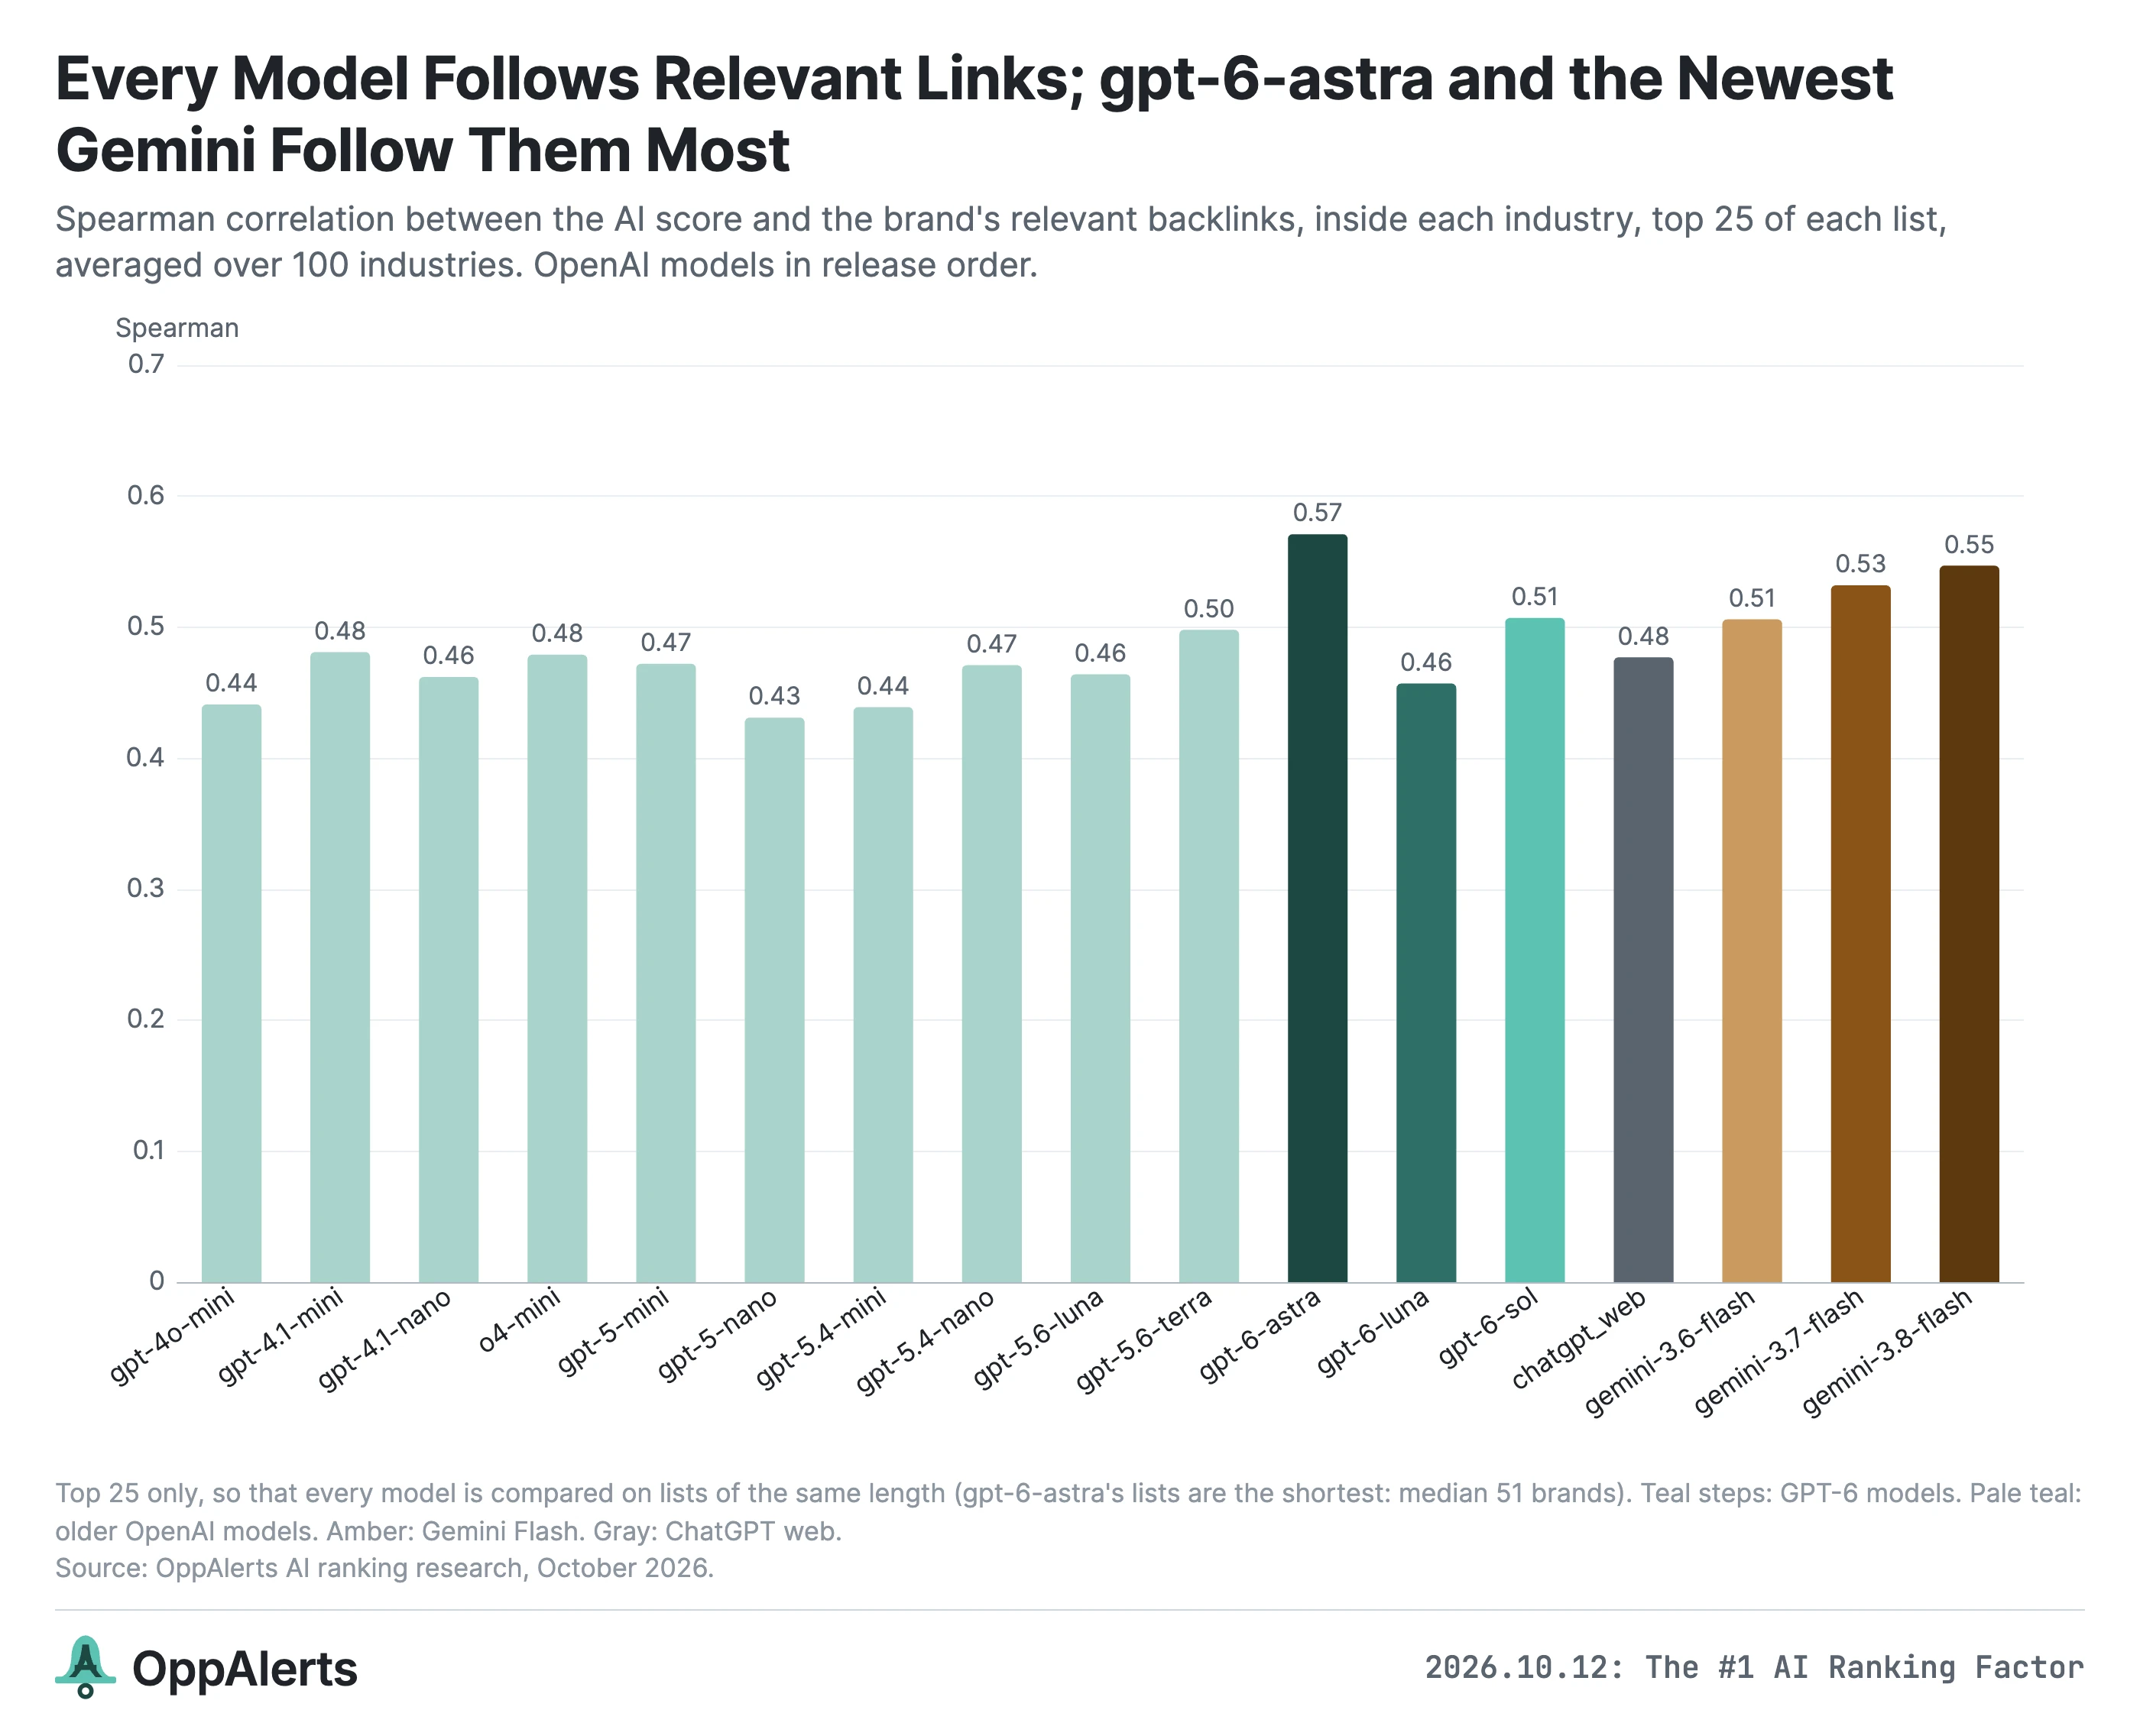
To compare models, I used the top 25 from each list. Otherwise, we'd be comparing GPT-6 Astra's shorter lists with models that regularly fill 100 places.
On those top 25, the average within-industry correlation between AI score and relevant backlink count is:
- GPT-6 Astra: 0.57, the highest of the 17 channels. GPT-6 Sol is 0.51, and GPT-6 Luna is 0.46.
- Gemini Flash: 0.51, 0.53, and 0.55 for versions 3.6, 3.7, and 3.8. Each version has a stronger relationship than the previous one.
- The other 10 OpenAI models: 0.43 to 0.50, from GPT-5 Nano to GPT-5.6 Terra, without a steady increase by release date.
- ChatGPT web: 0.48. The pattern also holds in the interface people use, where web search is available.
The models also agree on a lot of the brands they recommend. Here's how much their top 10 lists overlap, averaged across all 100 industries:
| Models compared | Top 10 in common | Hotels & resorts |
|---|---|---|
| gemini-3.7-flash and gemini-3.8-flash | 85% | 9 of 10 |
| gpt-6-astra and gpt-6-sol | 78% | 6 of 10 |
| gpt-6-astra and gemini-3.8-flash | 77% | 8 of 10 |
| gpt-6-sol and gpt-6-luna | 76% | 7 of 10 |
| gpt-6-astra and ChatGPT web | 74% | 5 of 10 |
| gpt-4o-mini and gpt-6-astra | 56% | 4 of 10 |
GPT-6 Astra and Gemini 3.8 Flash share 77% of their top 10 recommendations. GPT-4o Mini and GPT-6 Astra share 56%.
And the brands that both GPT-6 Astra and Gemini 3.8 Flash put in their top 10 have a median of 655 relevant backlinks. Brands that make only one model's top 10 have 189.
So the brands with more relevant backlinks are also more likely to appear consistently across those two models.
Google's organic results have a much weaker relationship with this measure: 0.15 on the full lists and 0.07 on the top 25. But remember what those results contain. For hotels, Google often returns publishers and review sites. We're comparing a different kind of list.
How much work this takes depends on your industry
This is where I would start if I were using the research to plan a campaign.
The number of relevant backlinks behind a top 10 recommendation varies enormously by industry.
For each industry, I took GPT-6 Astra's top 10 brands and calculated their median relevant backlink count, total link count, and PageRank.
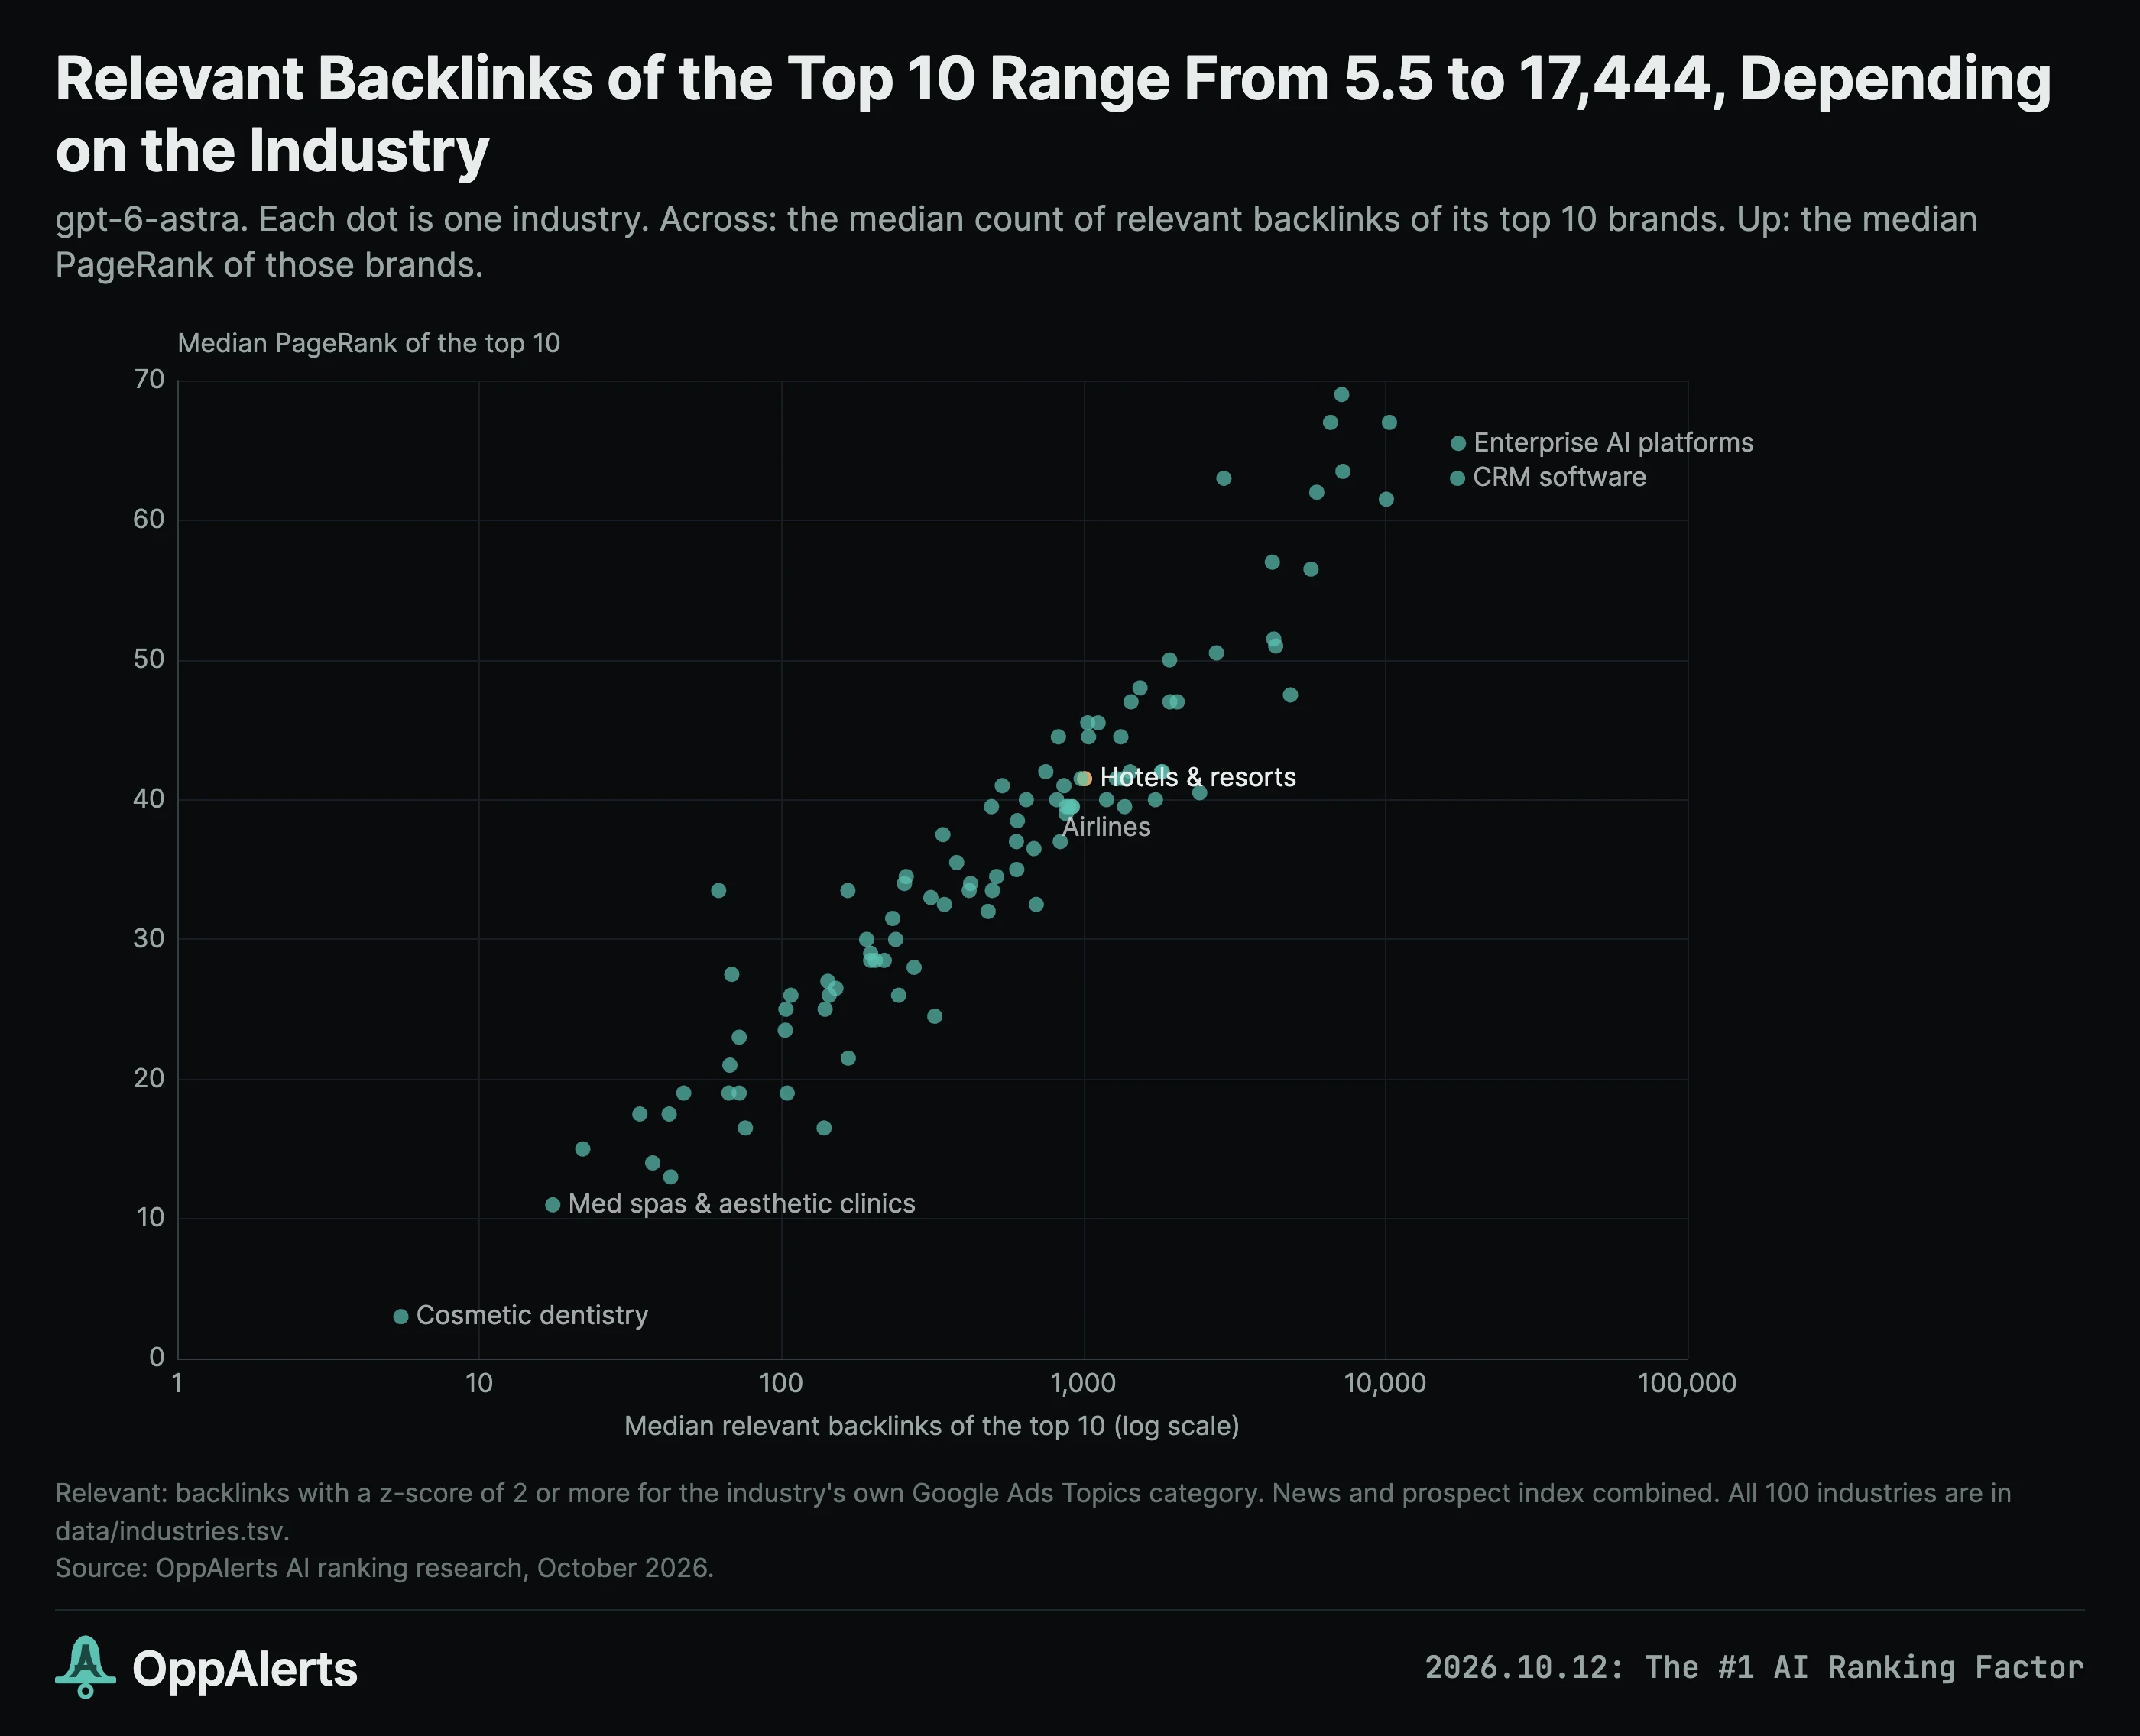
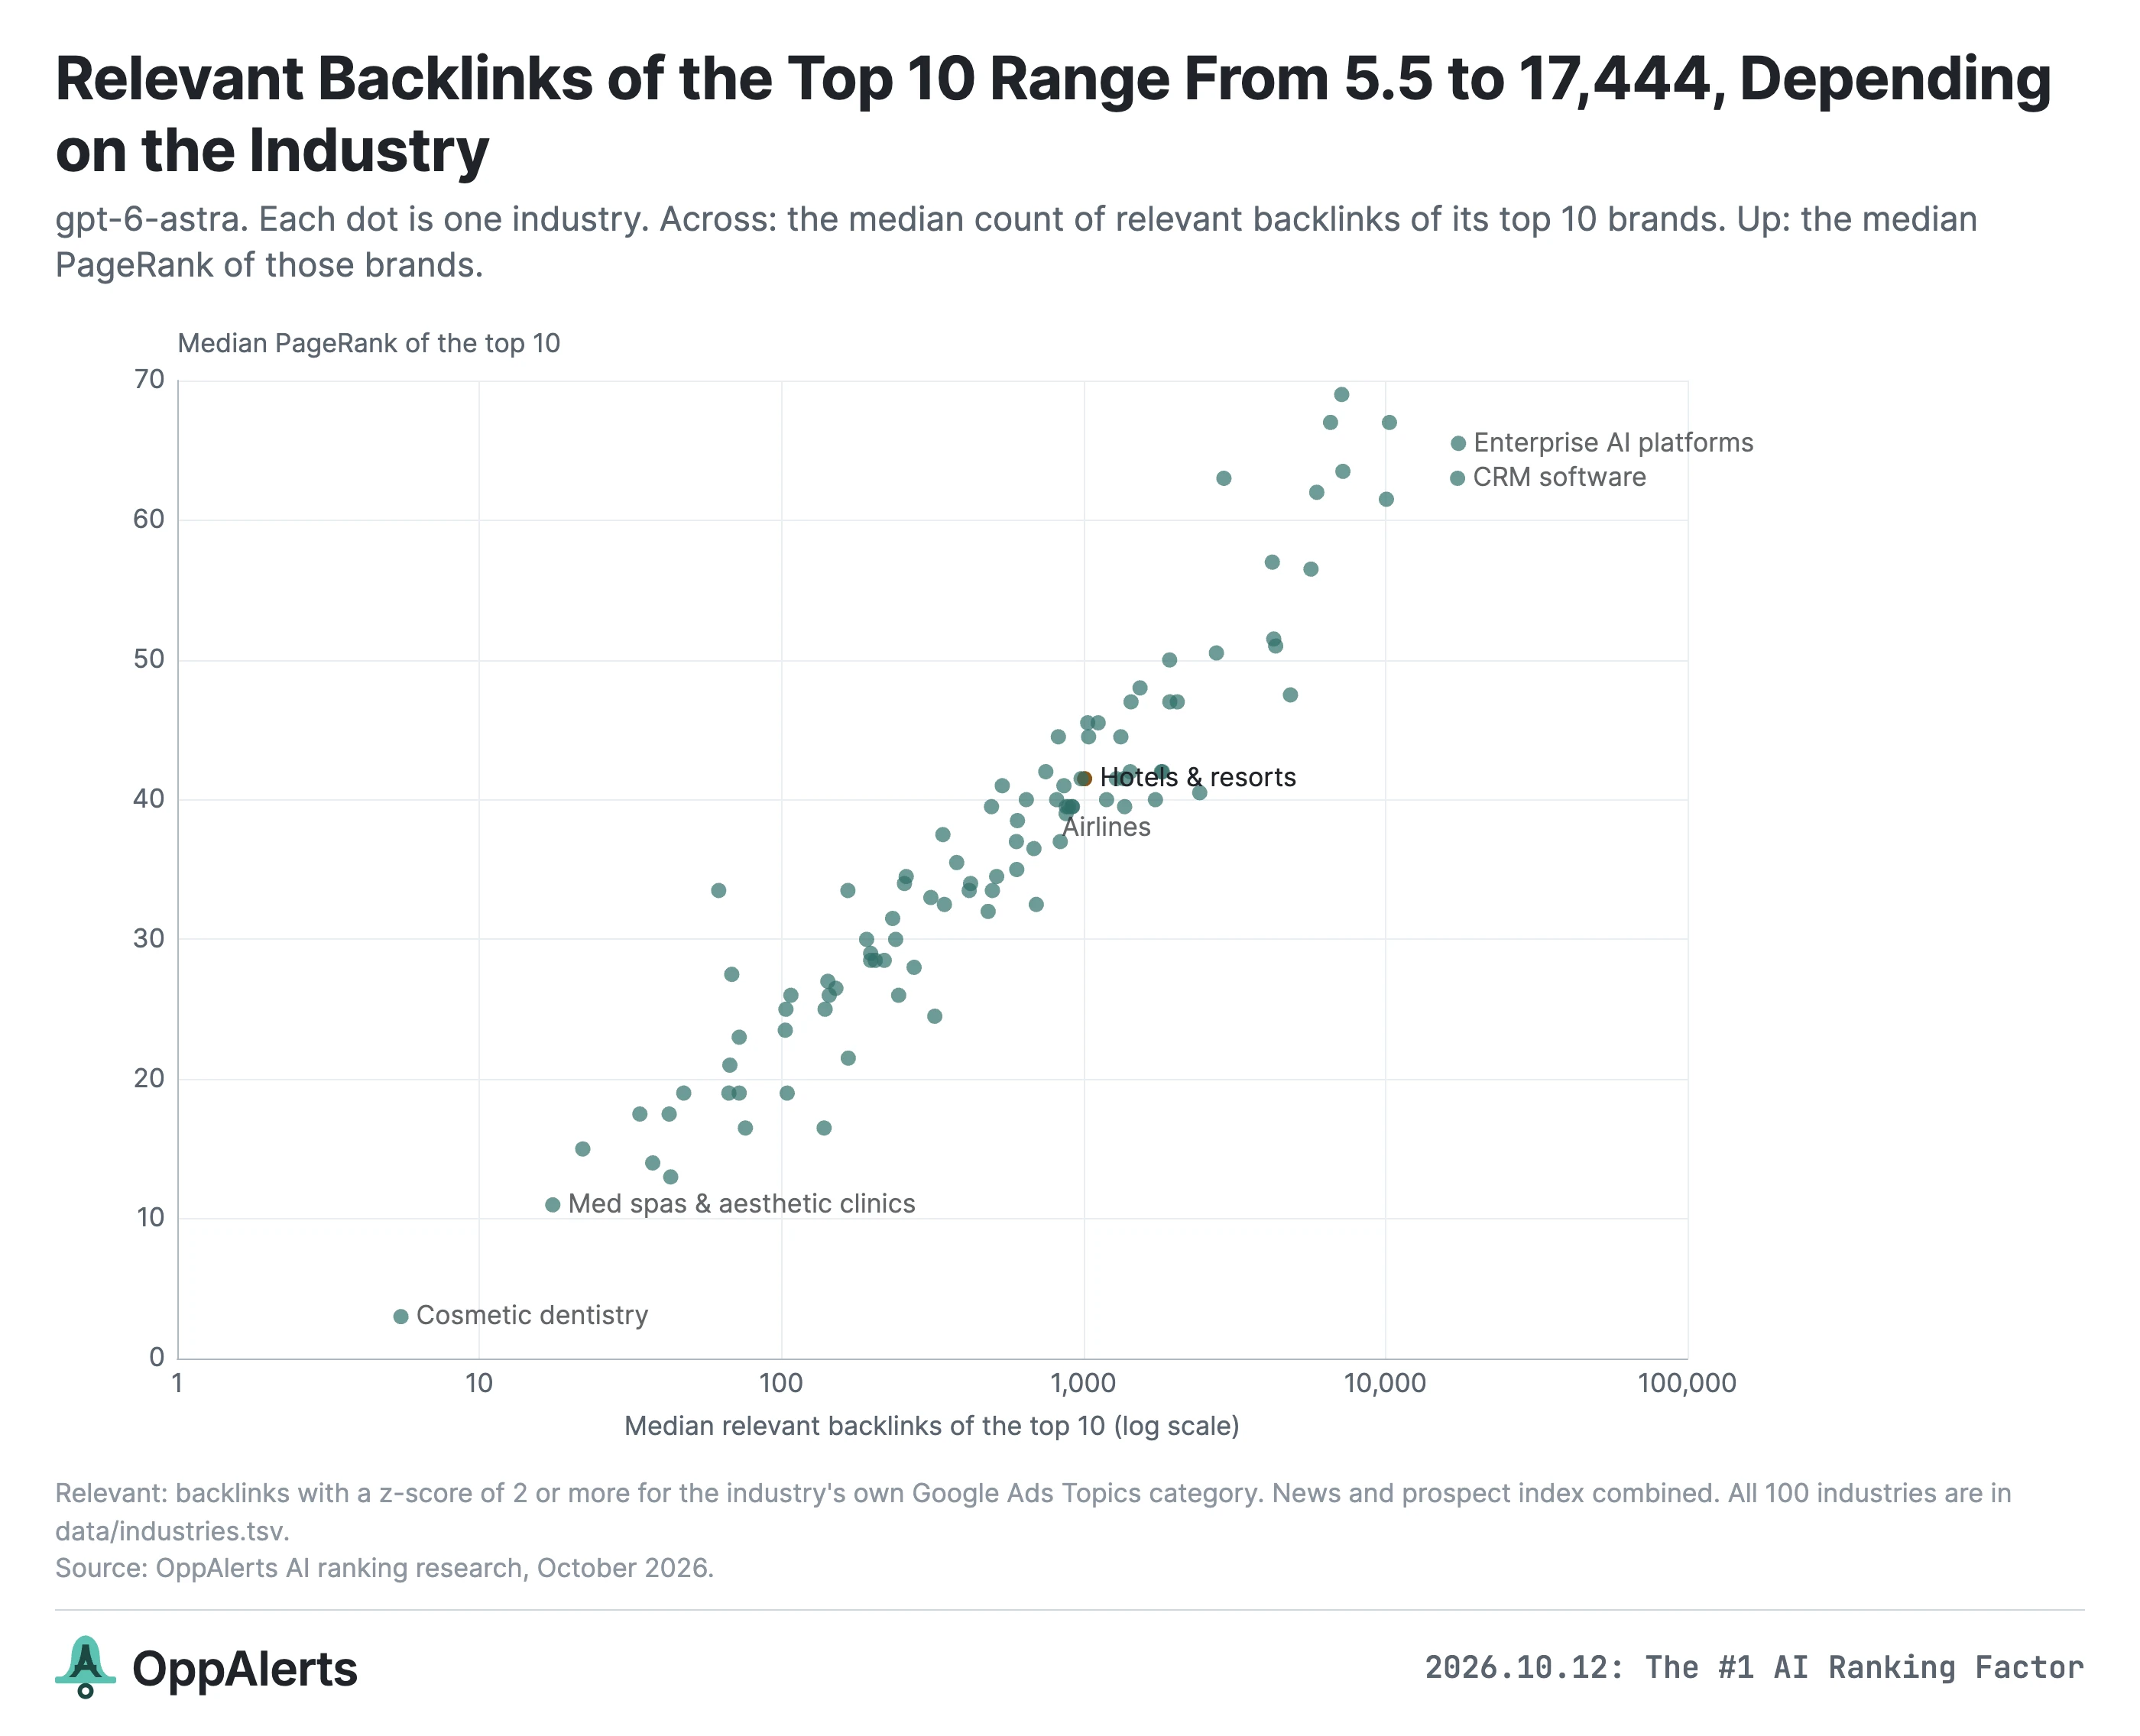
| Industry | Relevant backlinks (top 10 median) | All backlinks | PageRank |
|---|---|---|---|
| Enterprise AI platforms | 17,443.5 | 52,542 | 65.5 |
| CRM software | 17,327.5 | 36,803 | 63 |
| Martech, CDP and attribution | 10,307 | 18,394 | 67 |
| Enterprise search and copilots | 10,068.5 | 20,132 | 61.5 |
| Airlines | 1,193 | 1,603 | 40 |
| Hotels & resorts | 1,009 | 1,934.5 | 41.5 |
| Residential solar installers | 37.5 | 52 | 14 |
| Dermatology groups | 34 | 63 | 17.5 |
| Cosmetic-surgery clinics | 22 | 25 | 15 |
| Med spas and aesthetic clinics | 17.5 | 20.5 | 11 |
| Cosmetic dentistry | 5.5 | 7 | 3 |
Some counts end in .5 because these are medians of 10 brands.
The top 10 in cosmetic dentistry have a median of 5.5 relevant backlinks in the indexes. The top 10 in CRM software have 17,327.5.
Those are very different competitive situations.
Across industries, the median relevant backlink count and median PageRank of the top 10 move together closely, with a Spearman correlation of 0.96. Software and data businesses tend to have the most pages. Local and regional services tend to have the fewest.
Industries with more pages also have a somewhat stronger relationship between relevant backlink count and AI rank within the industry. That correlation across industries is 0.28.
So there isn't one universal number of backlinks you should aim for. Look at your industry and the brands you're competing with. These counts give you a way to understand the size of the gap, within the indexes used for this research.
Hallucinations: Some of the recommended domains don't exist
Collecting all these recommendations also turned up a problem.
Every domain was checked against the ICANN zone files, RDAP, and DNS on October 6th, 2026.15 Of the 117,453 different domains in the full set of answers, 28,674 weren't registered. The registry returned “no such domain.” These are hallucinations: the AI models recommended websites that don't exist.
That's 24.4% of the unique domains. All came from the 17 AI channels. Google's organic results didn't return any unregistered domains for the same 2,500 searches.
That percentage counts each different domain once. The numbers below count every appearance of a domain in an answer, which gives us a better sense of how often someone would encounter one.
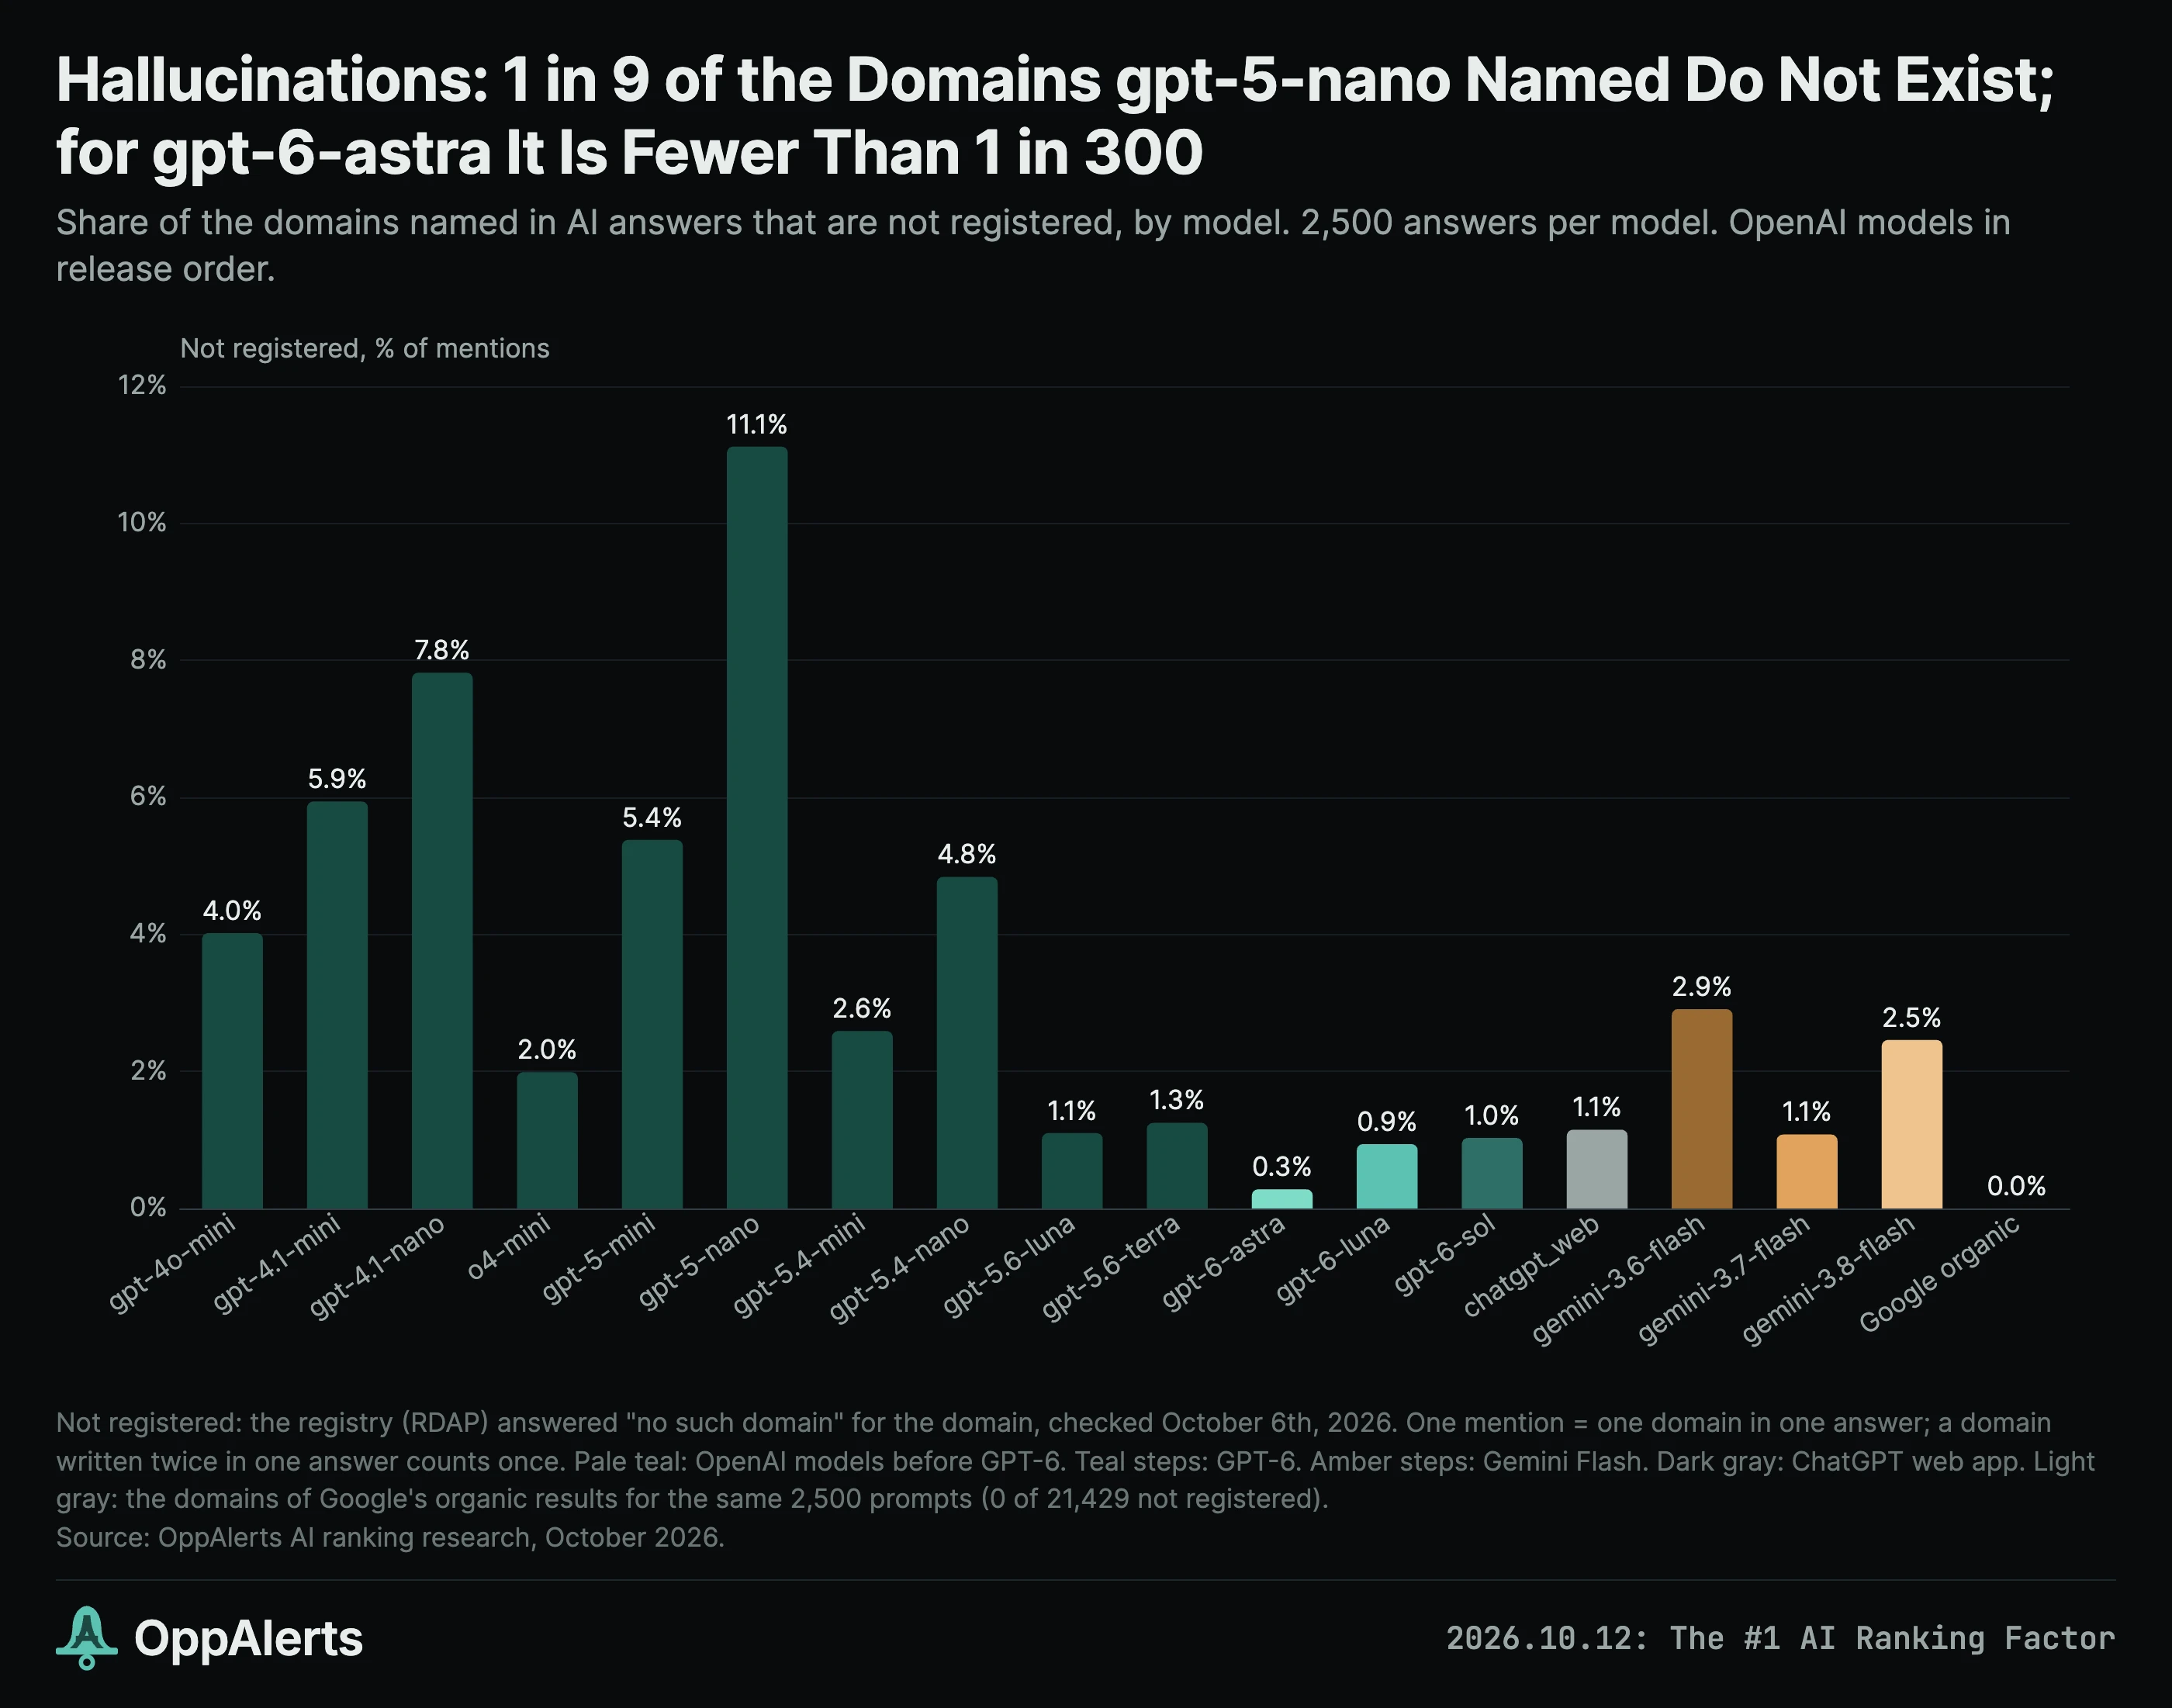
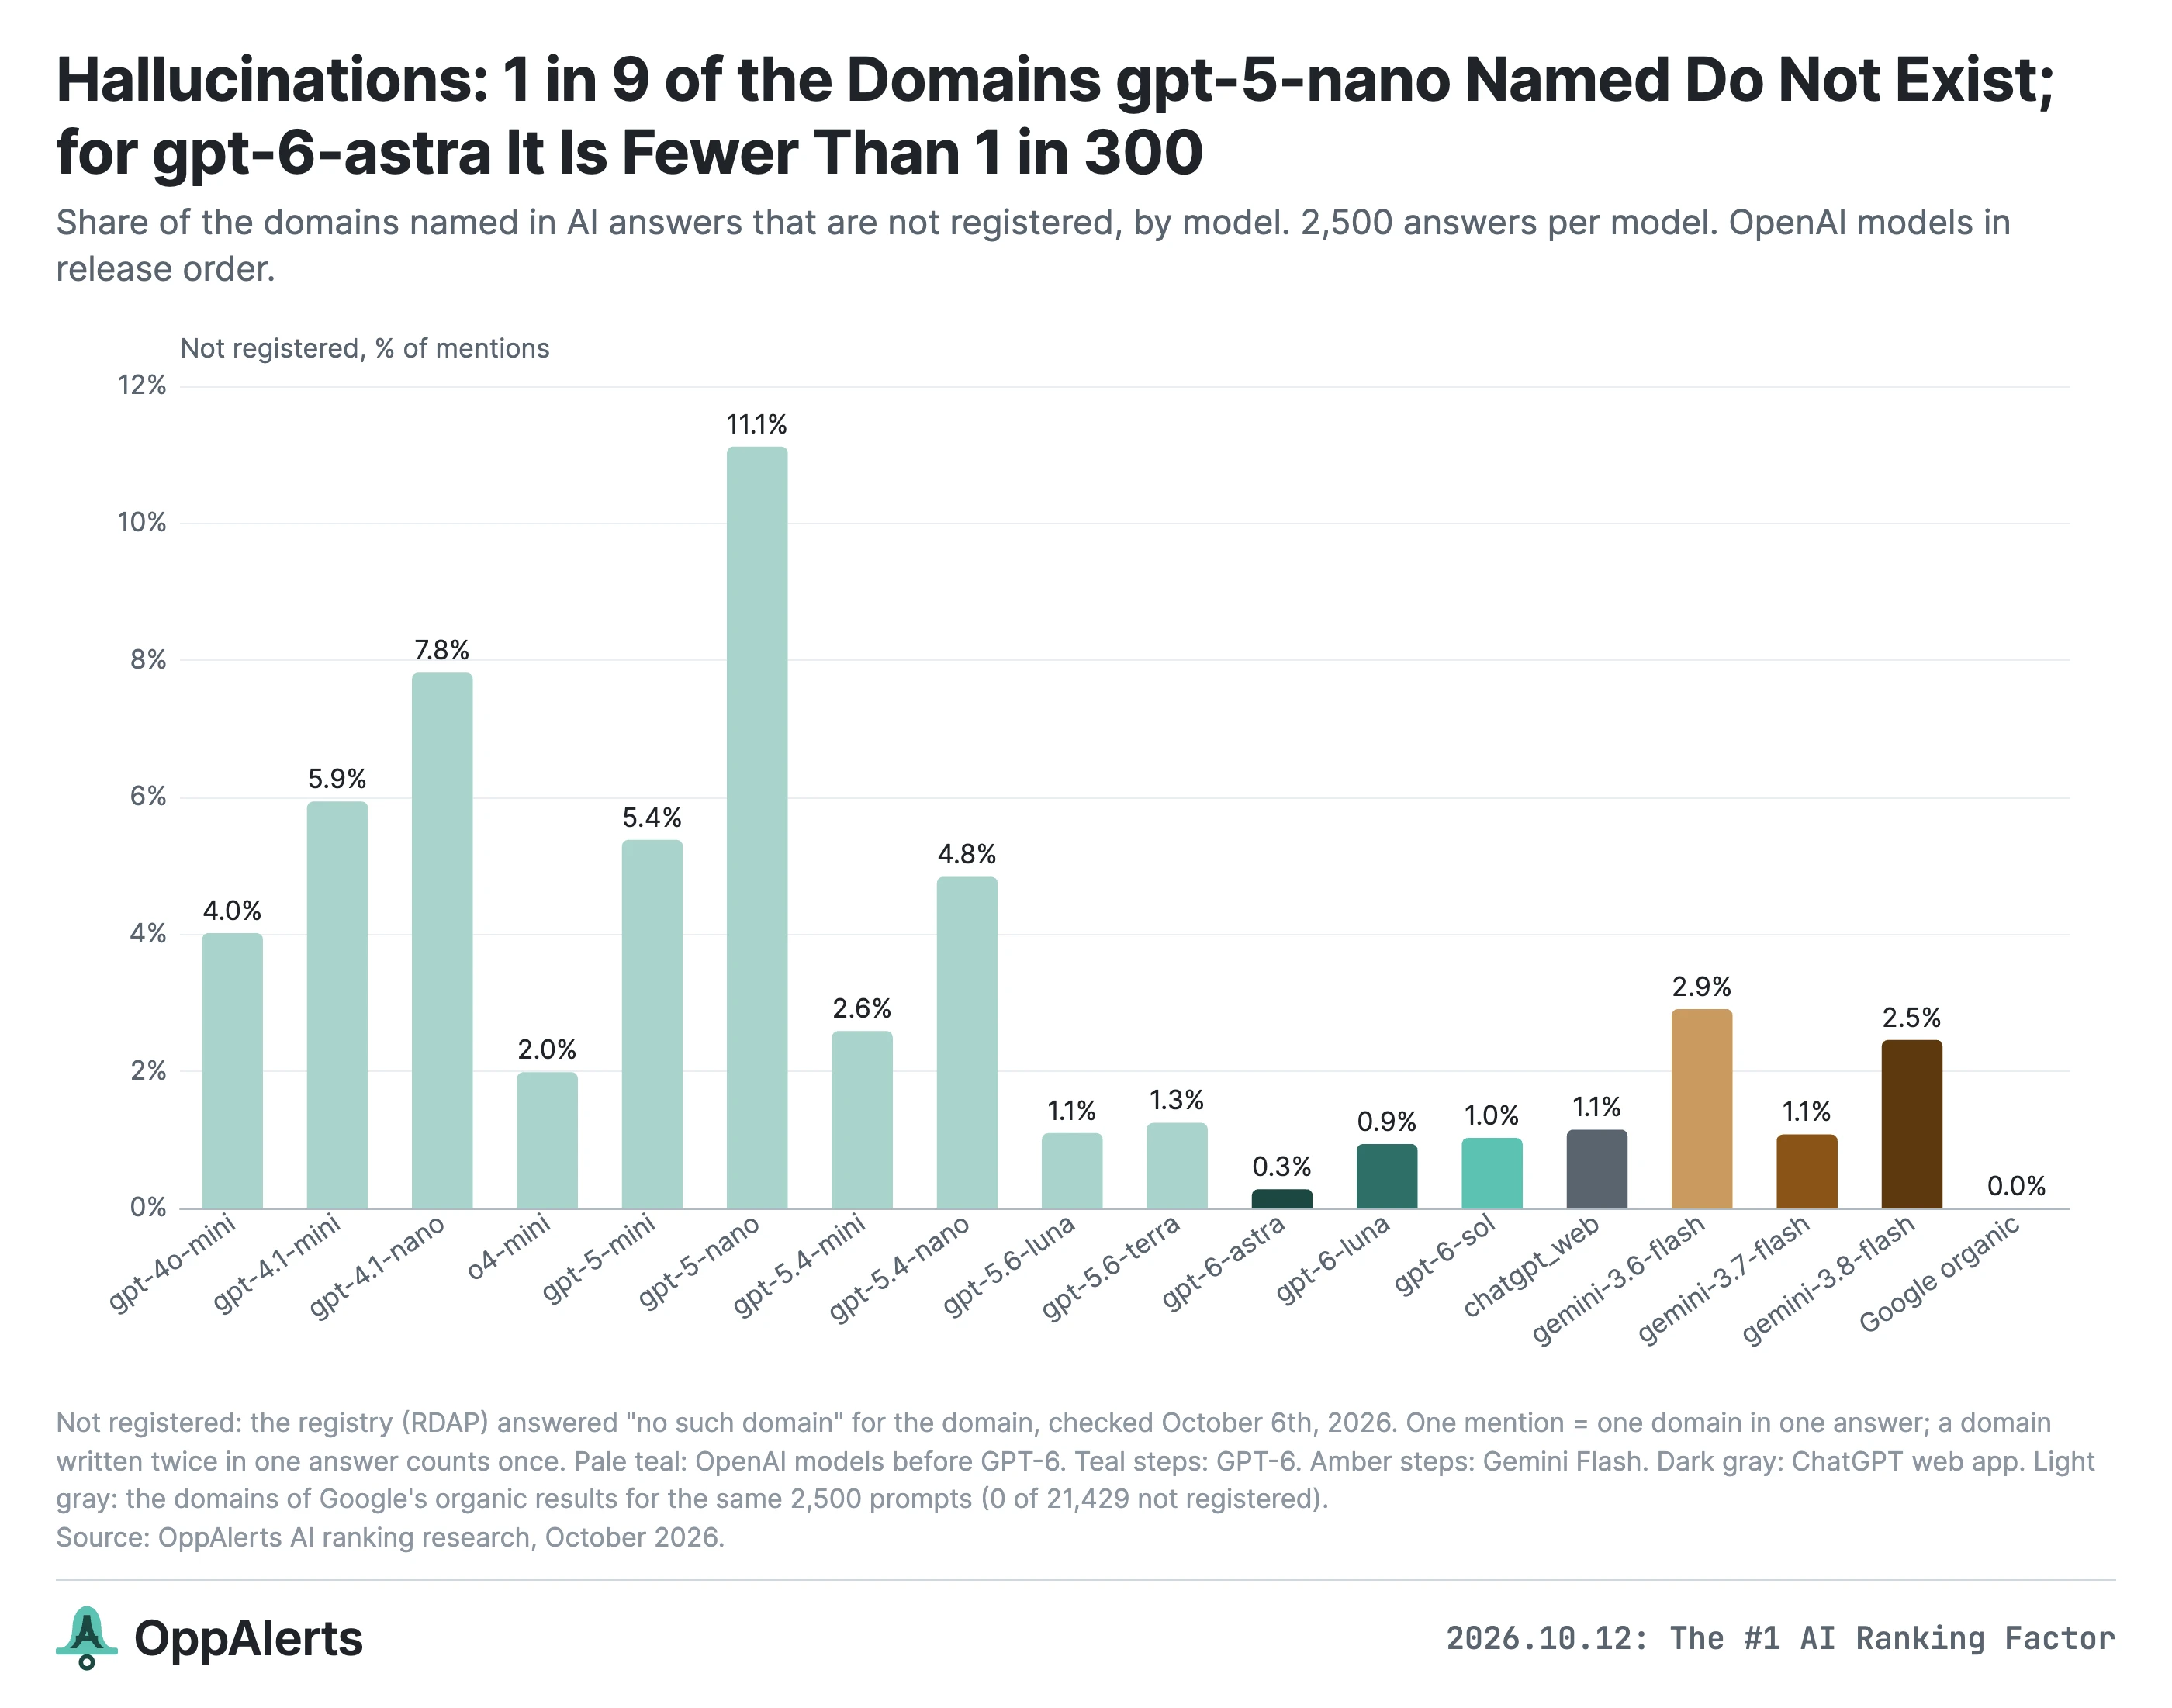
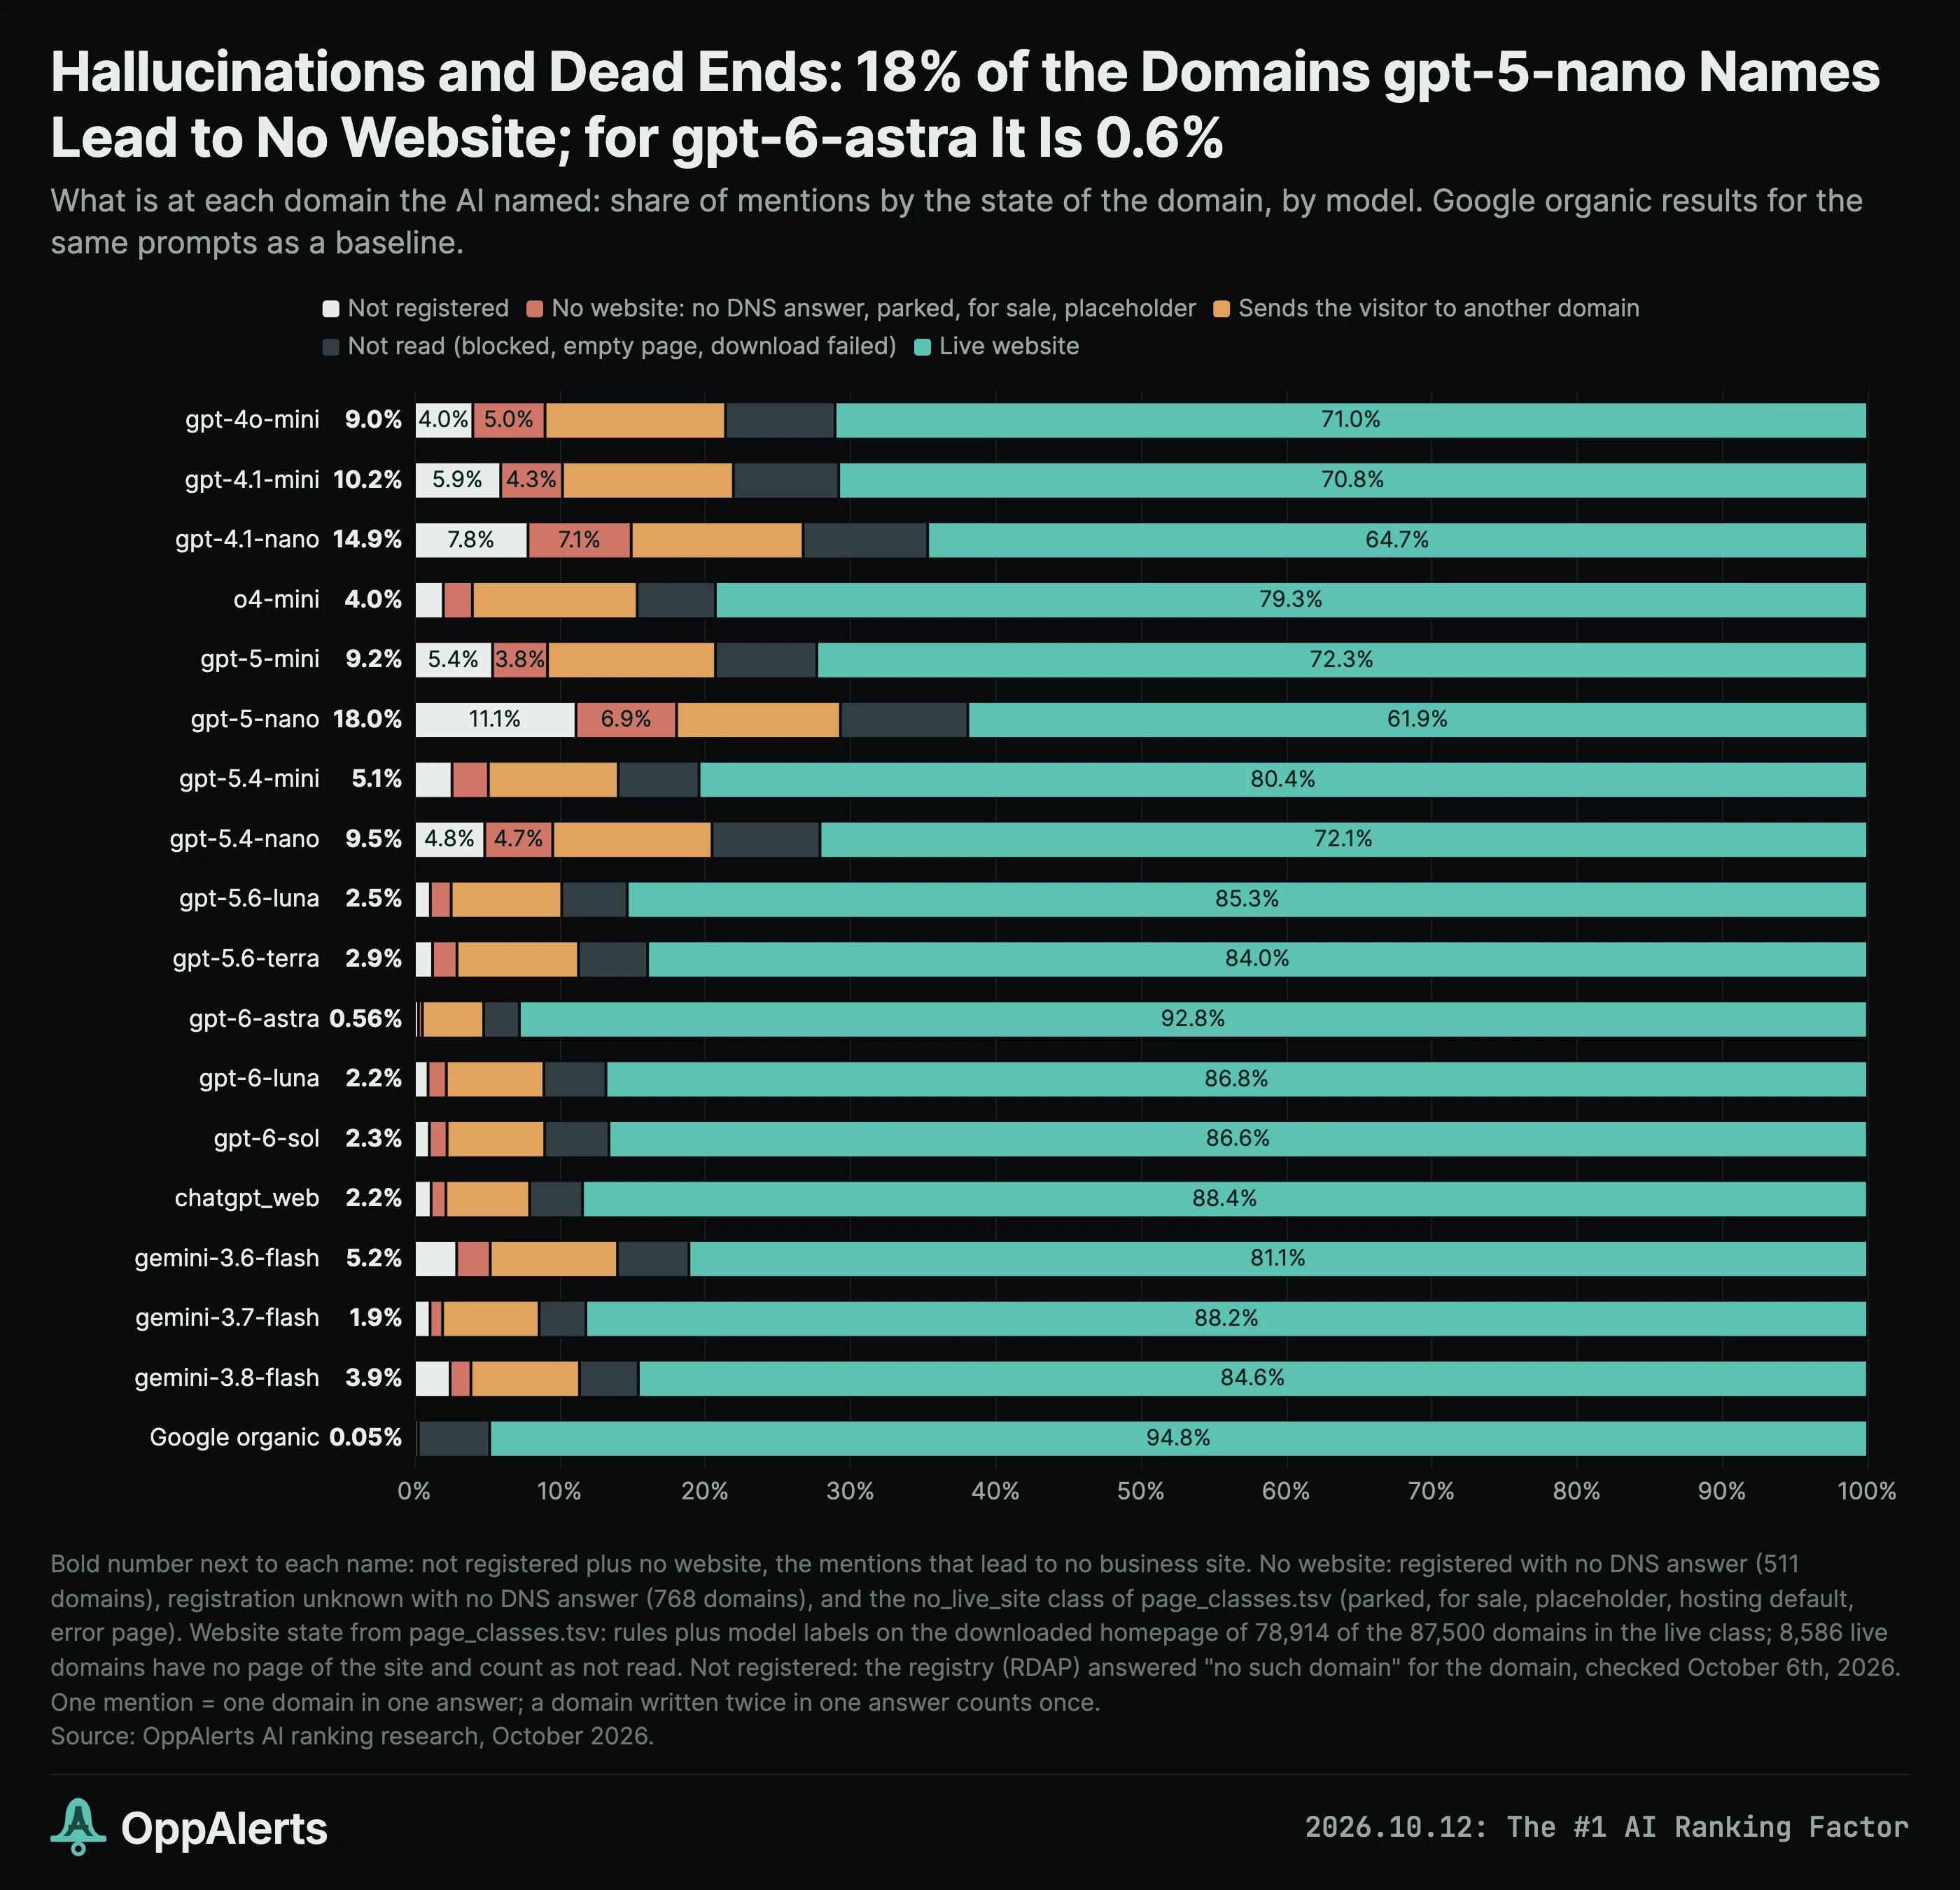
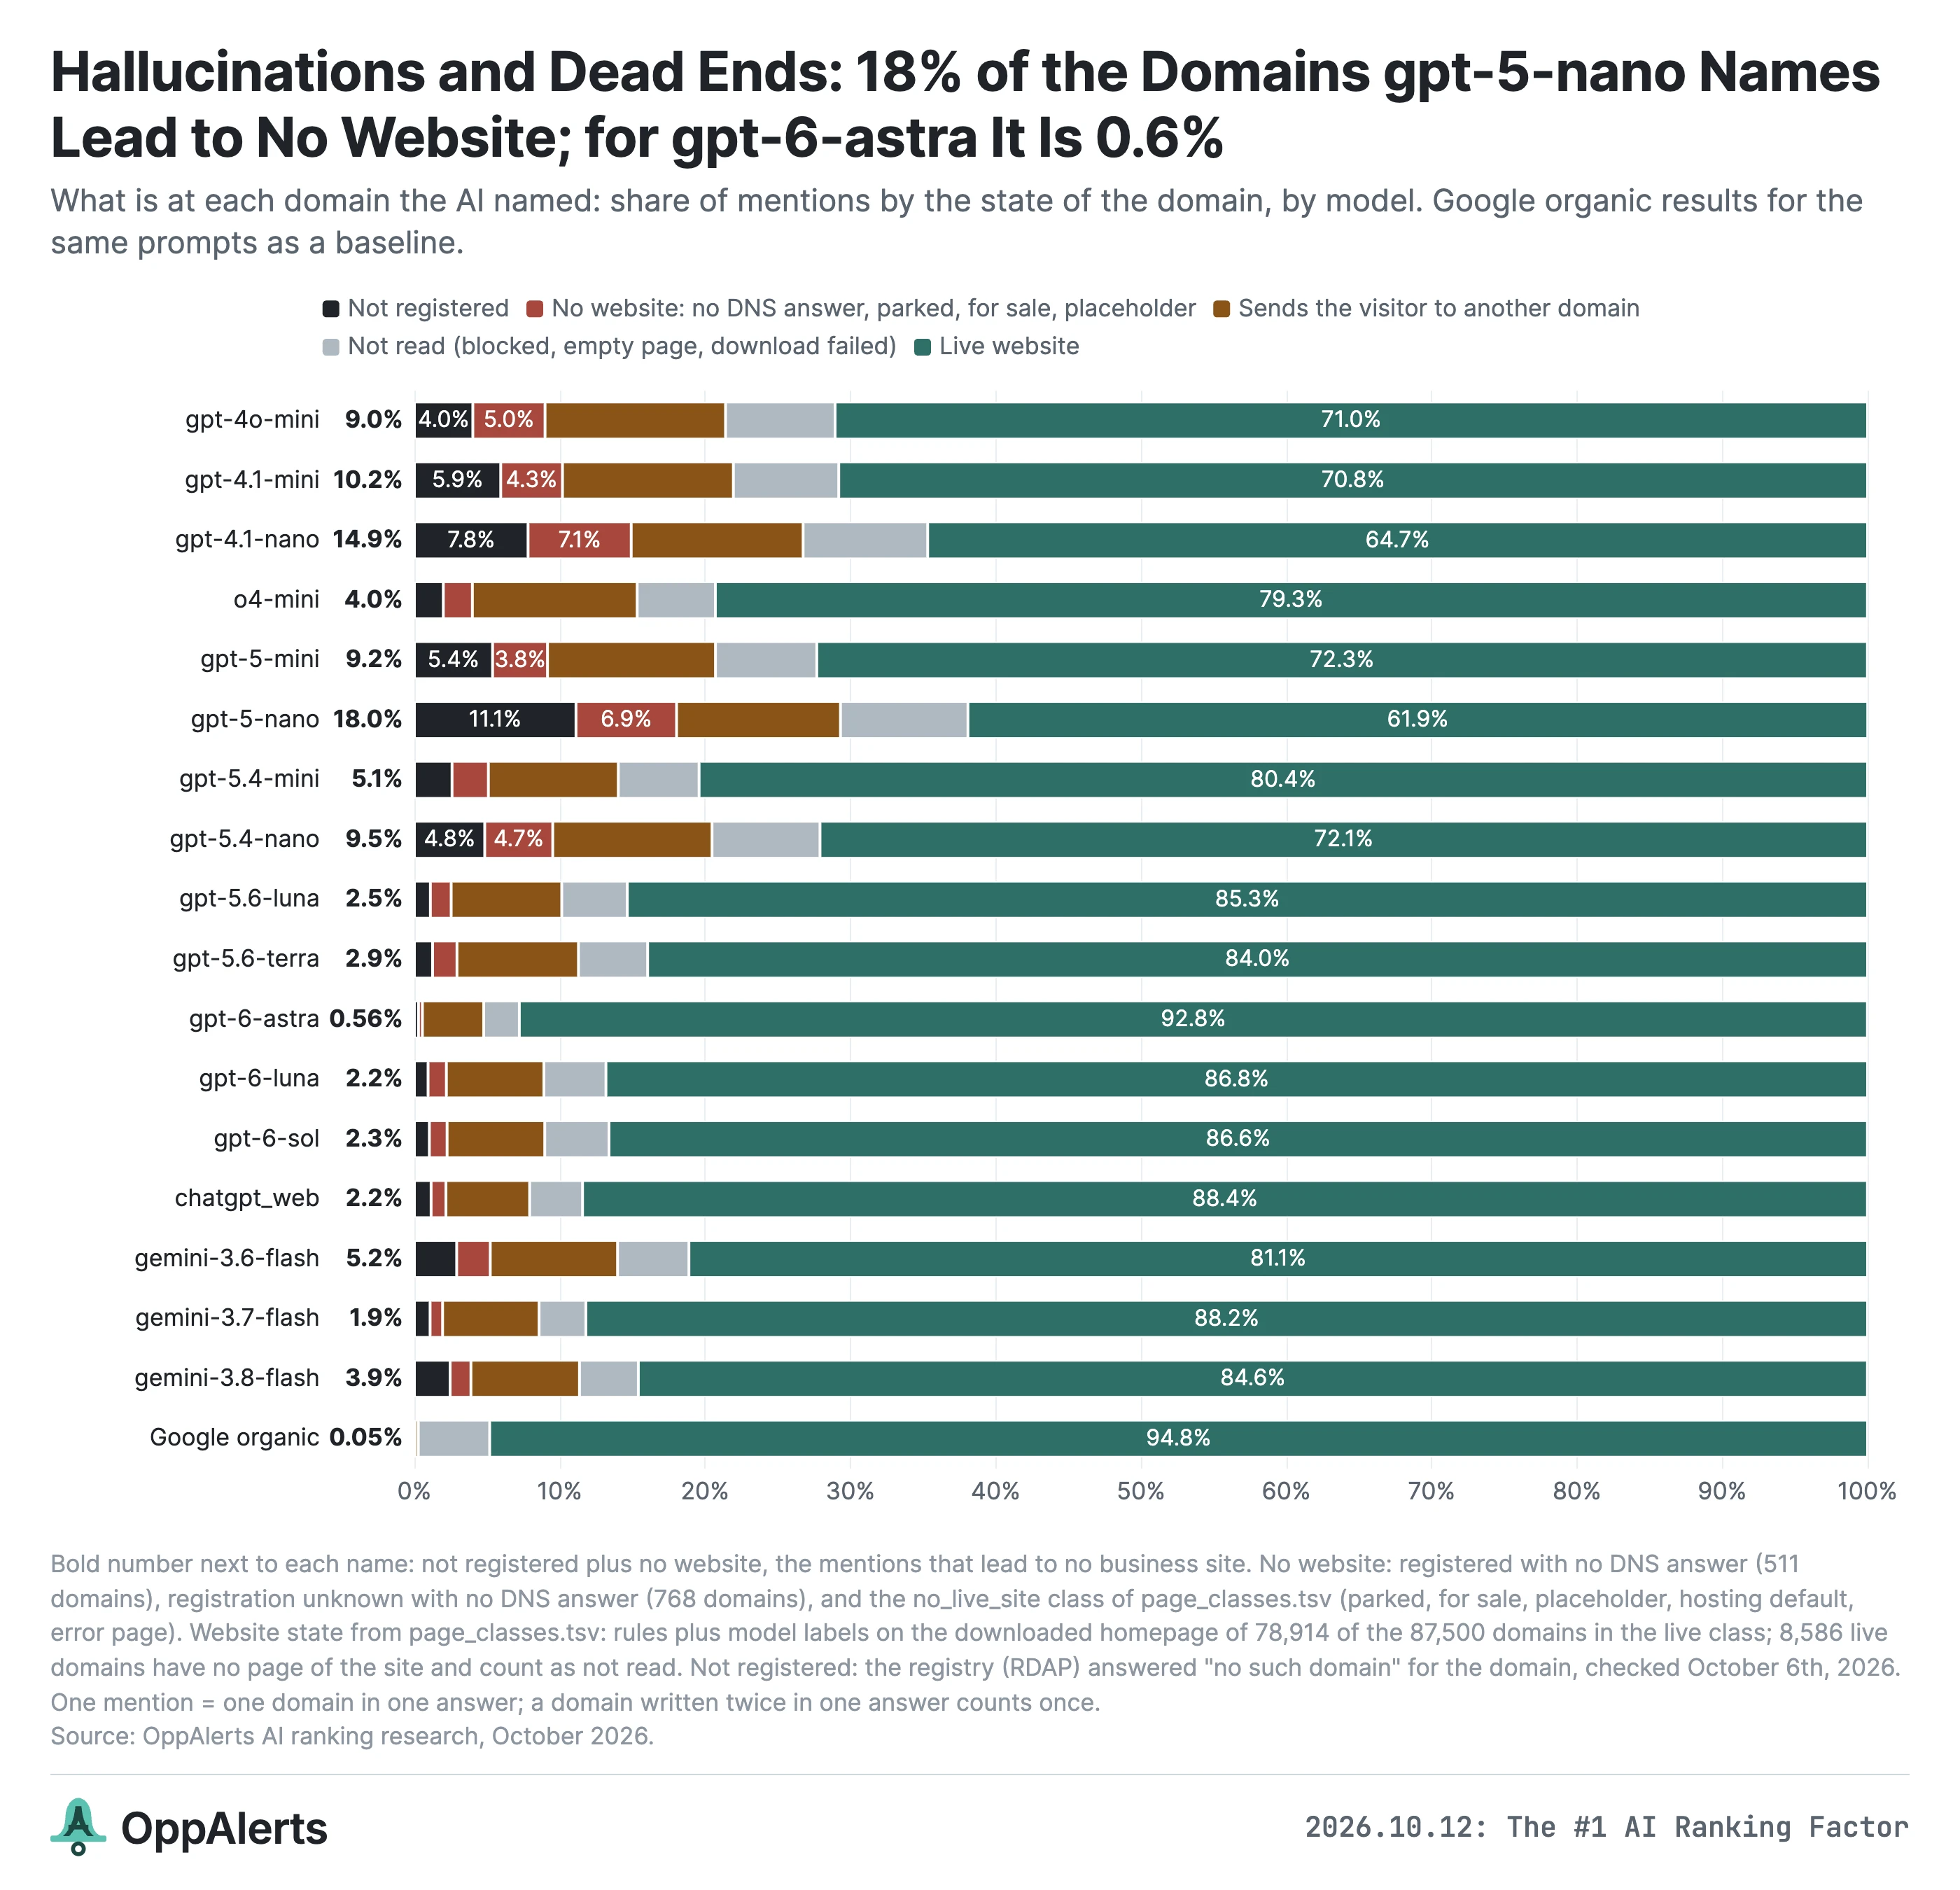
GPT-5 Nano hallucinated a domain in 11.12% of its recommendations, about one in nine. At least one appeared in 78.6% of its answers.
GPT-6 Astra was at 0.28%, fewer than one in 300 recommendations, with at least one in 4.8% of answers.
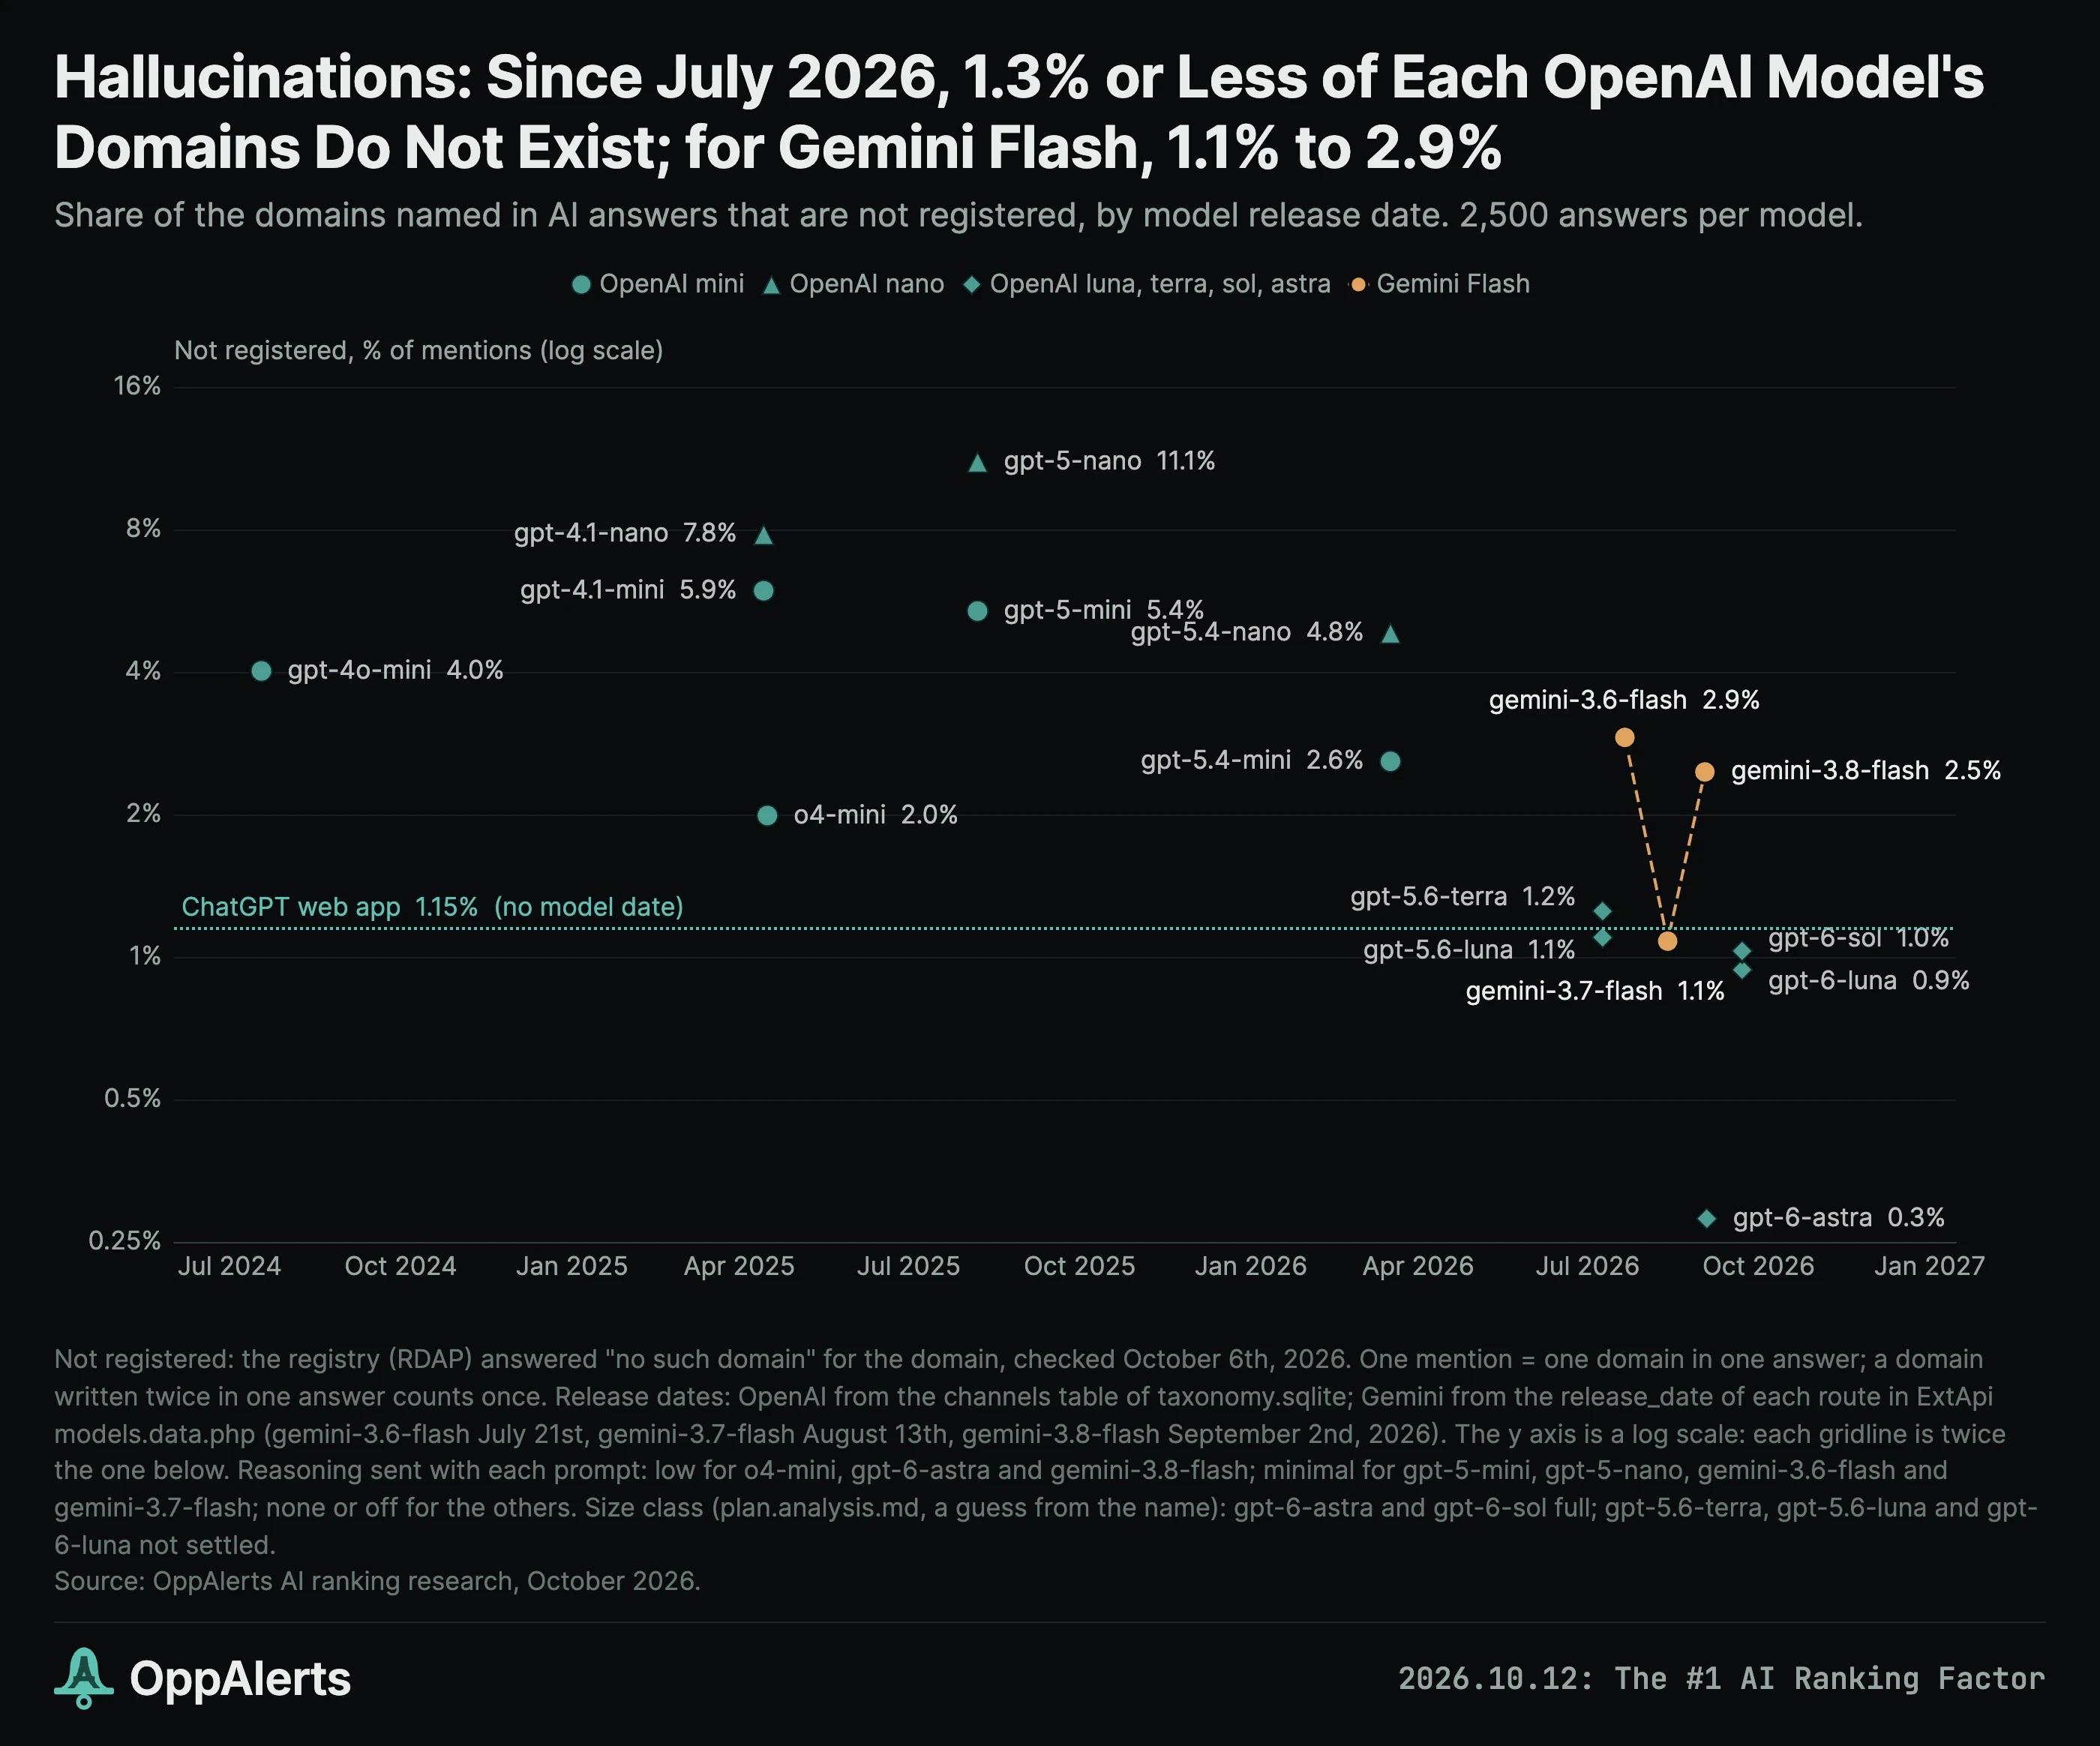
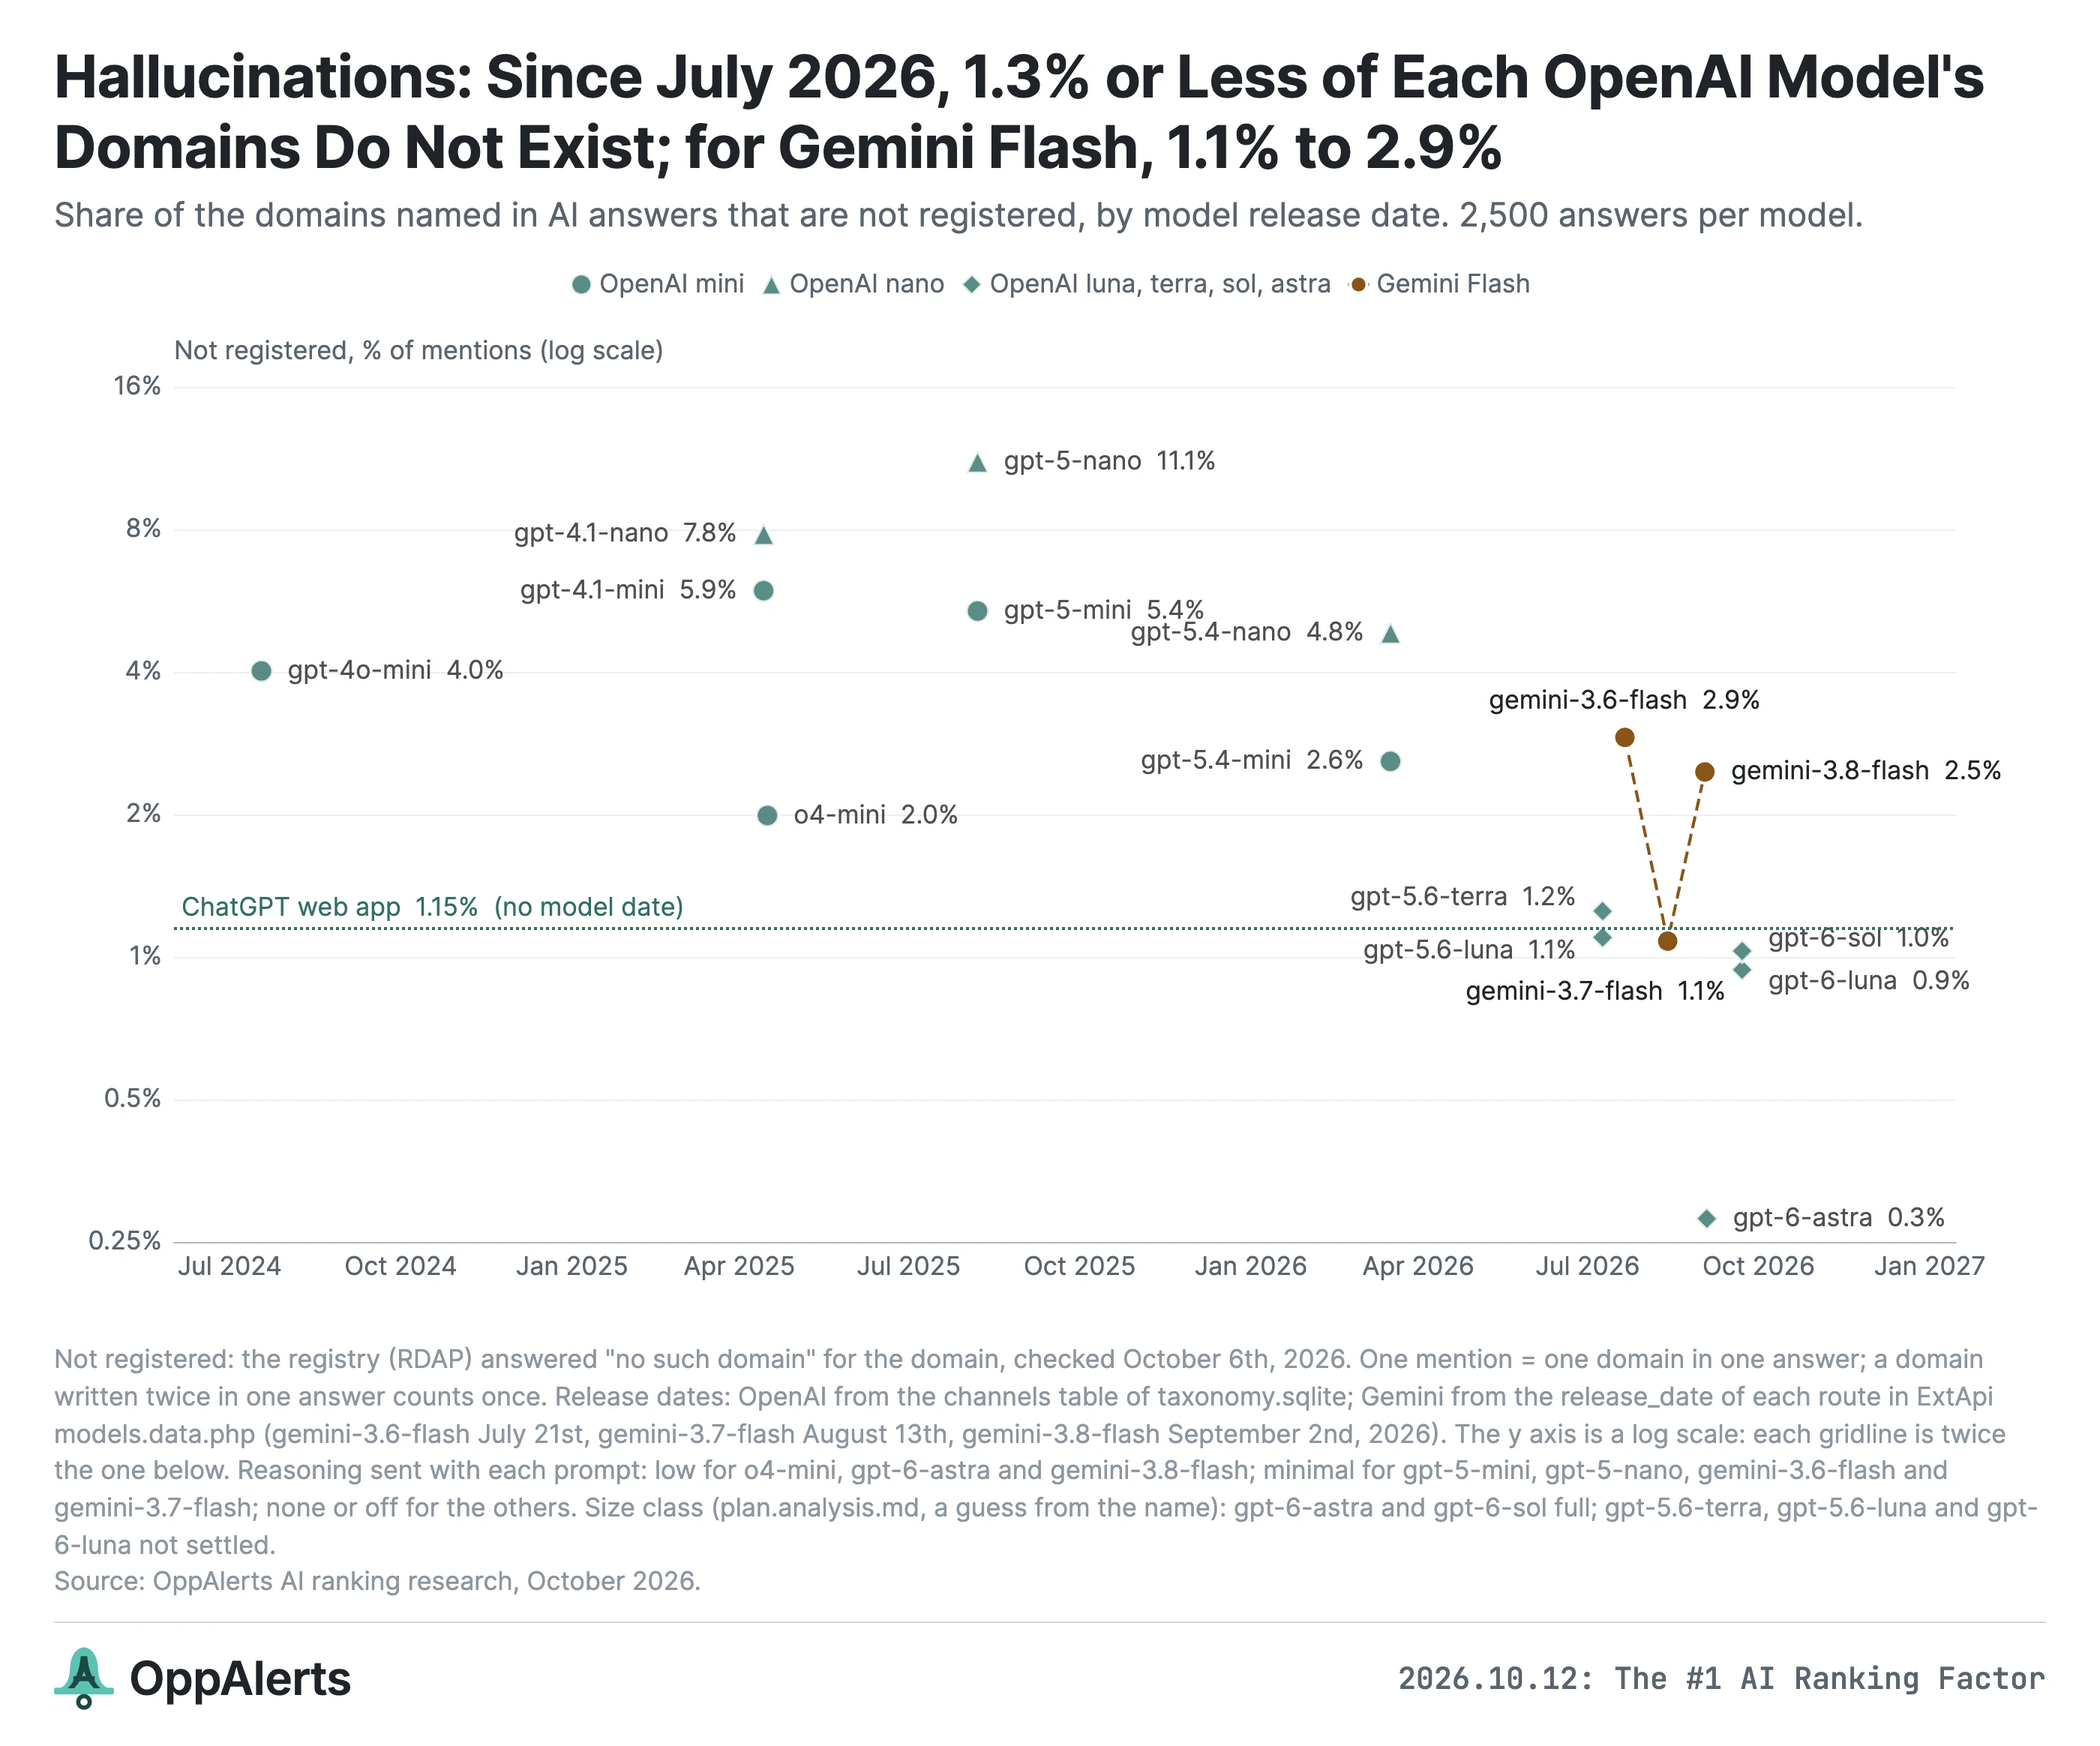
The newer OpenAI models did much better. Combining the results for the six models released before 2026 gives a rate of 6.03%. For the five released since July 2026, it's 0.92%, and none of those five exceeds 1.25%.16
Among models released on the same day, the nano versions hallucinated domains 1.3 to 2.1 times as often as the mini versions.
Gemini Flash didn't improve consistently: 2.91% for 3.6, 1.08% for 3.7, and 2.46% for 3.8. Gemini 3.8 Flash hallucinated a domain 8.8 times as often as GPT-6 Astra, despite the models being released a day apart.17
ChatGPT web was at 1.15%. Having web search available doesn't eliminate the problem.18
The hallucinations get more common further down the answers
Across the 17 channels, 1.13% of domains in the first position of an answer were hallucinated. By position 25, it was 4.73%.
The rate increased further down the answer in every model.
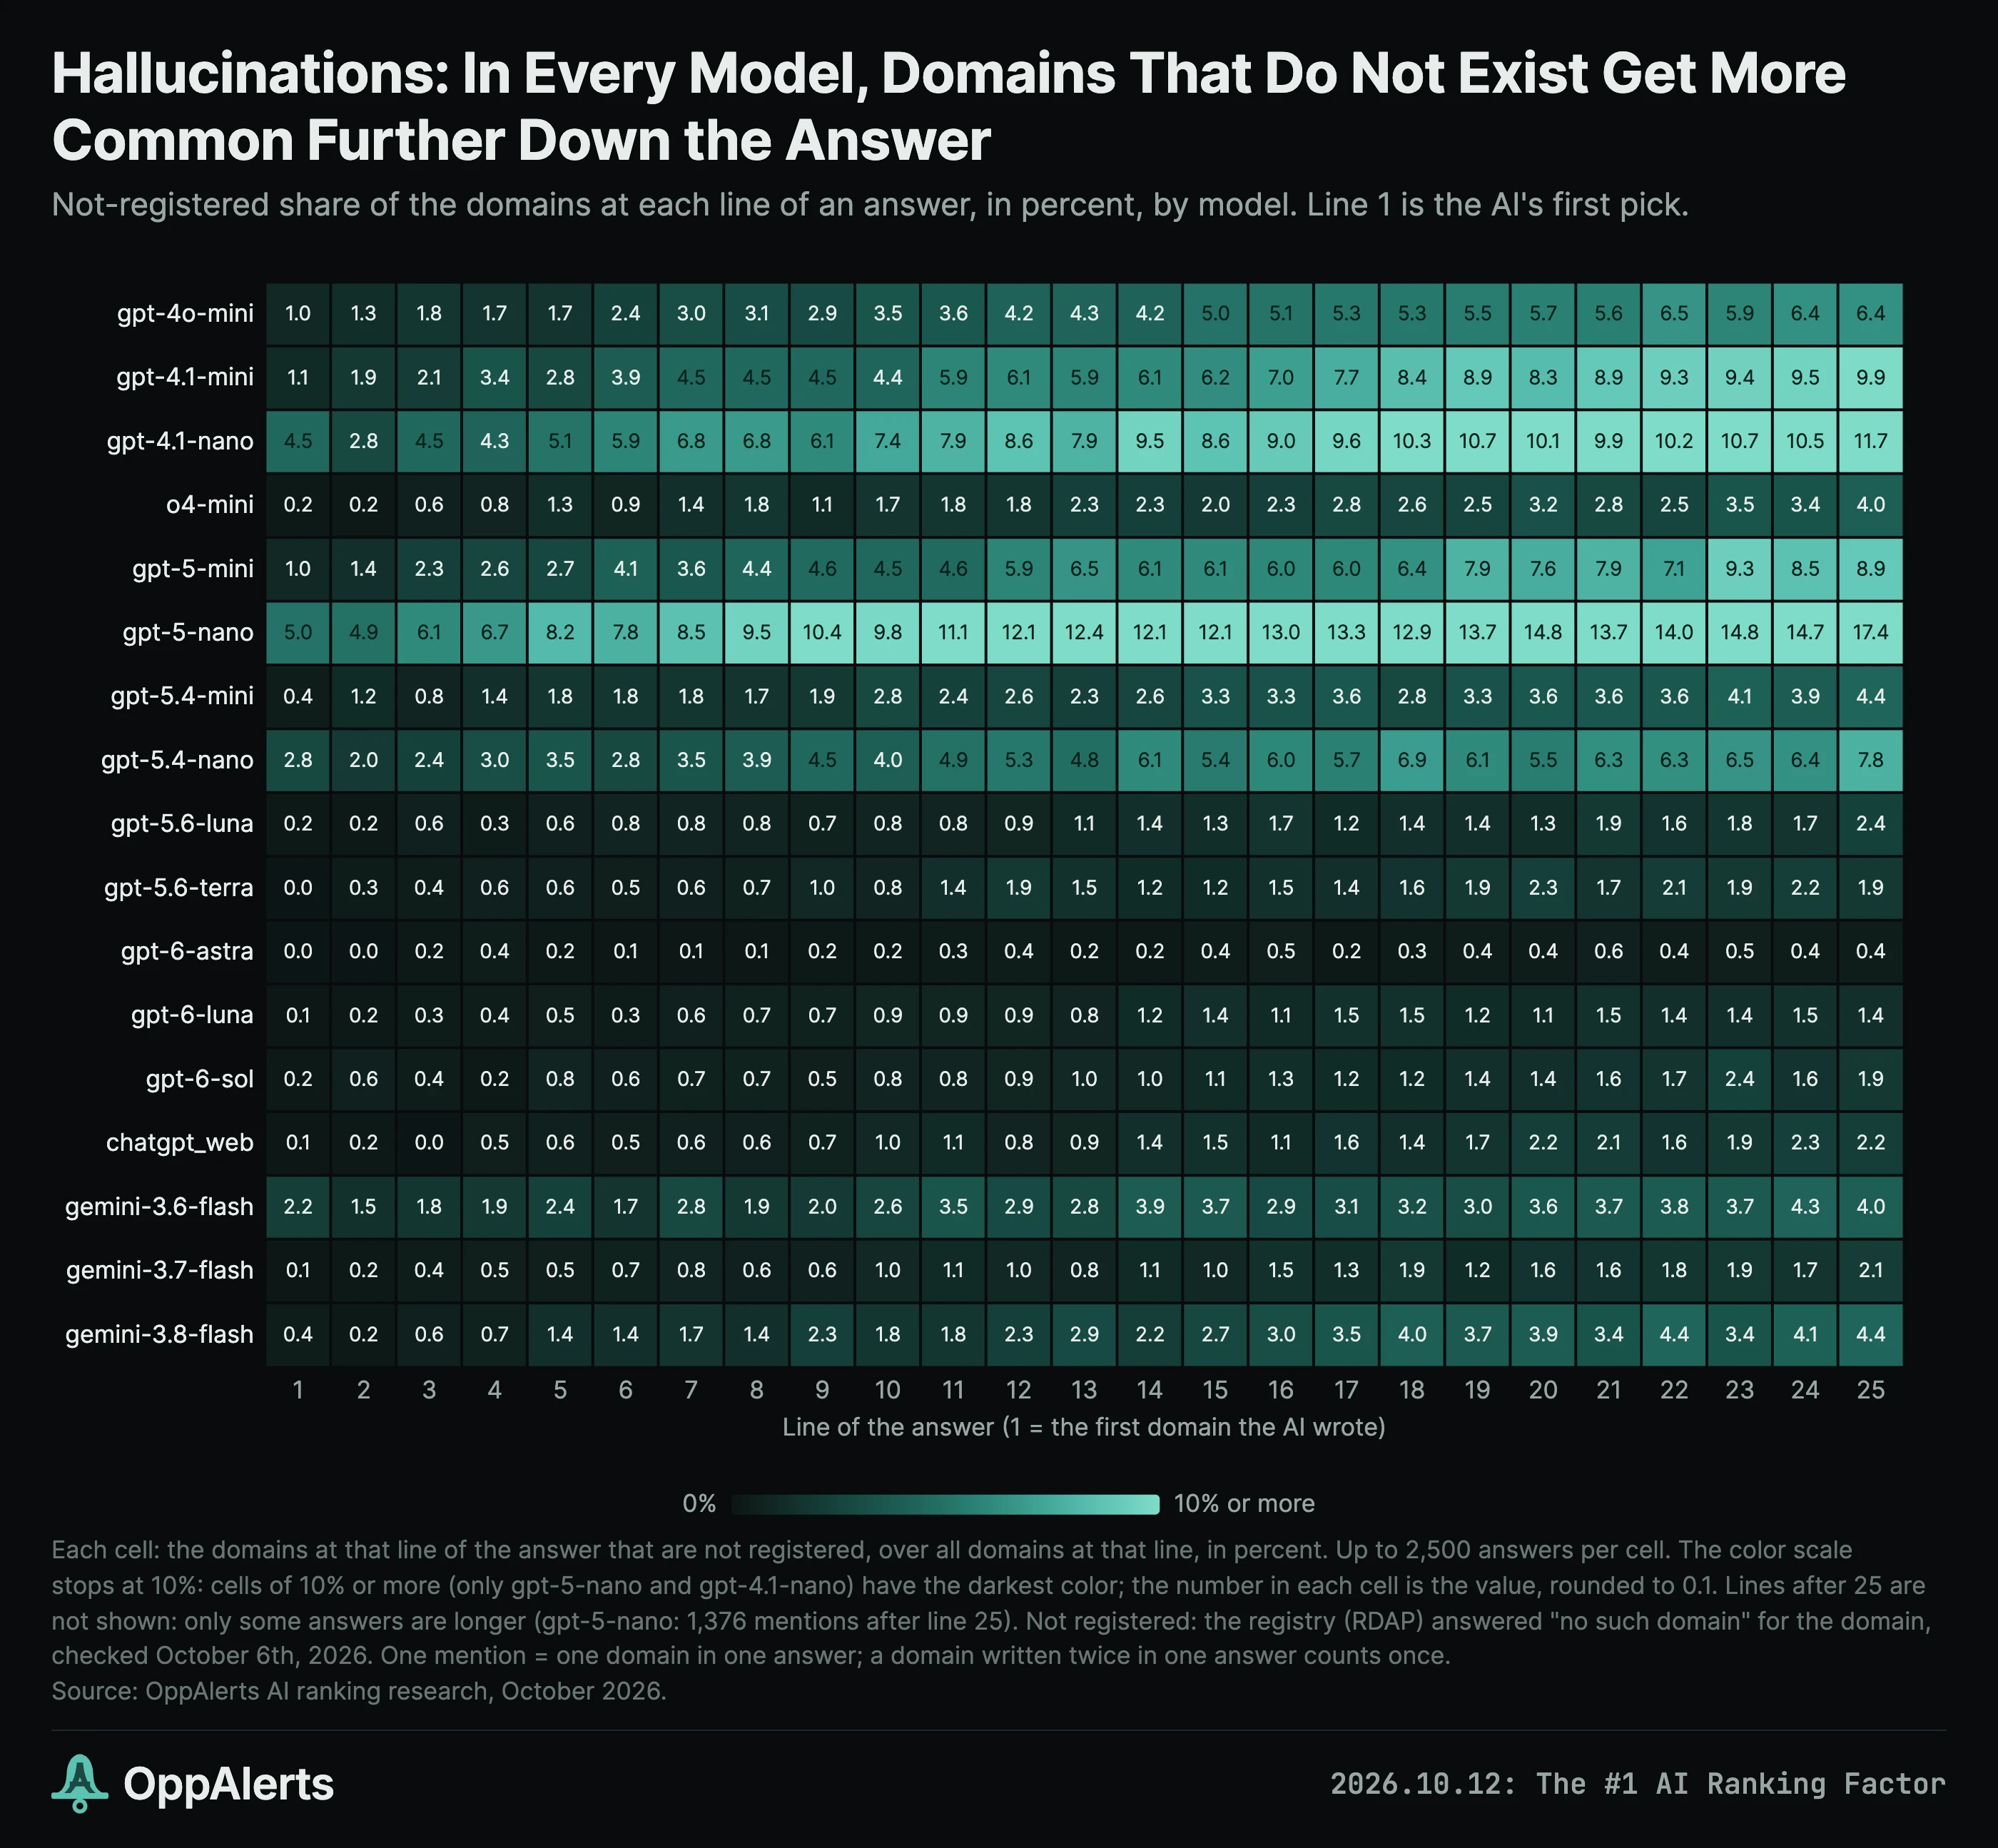
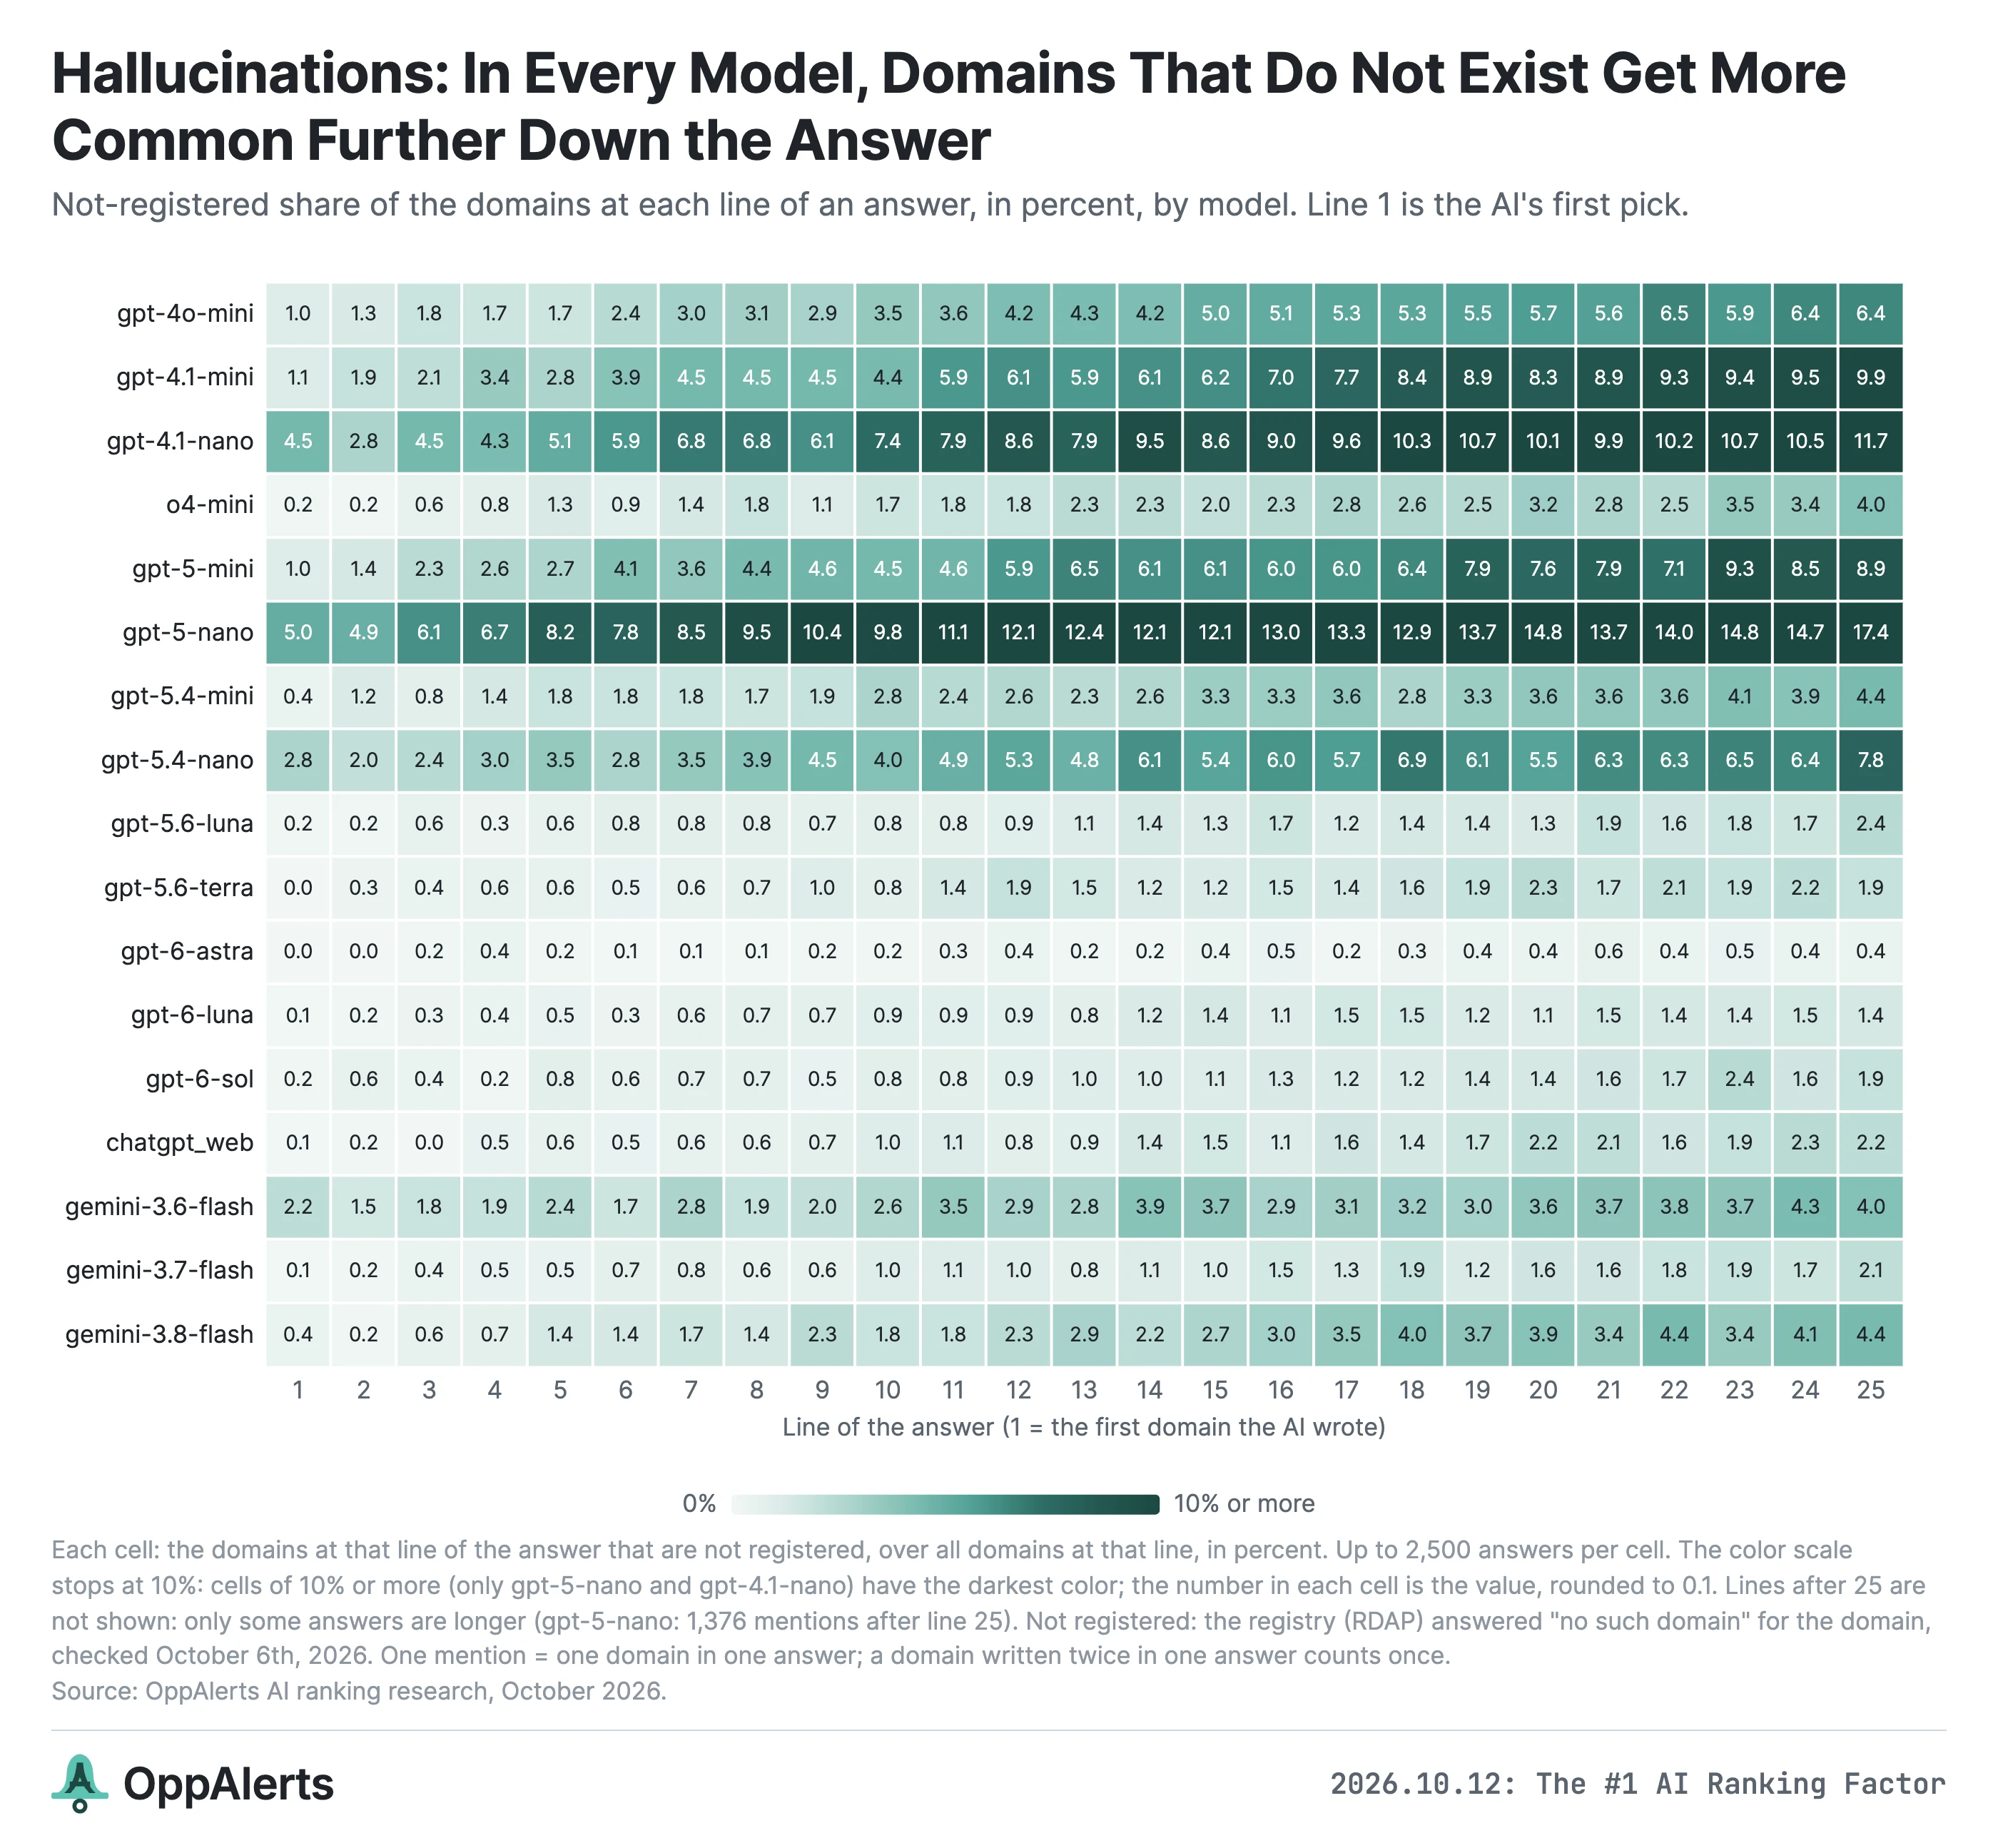
Most were also one-offs. A hallucinated domain appeared in only one of a model's 25 answers 94% of the time, compared with 55.5% for real domains.
When I combined scores across all 17 channels for each industry, no hallucinated domain reached an industry's top 25.
But some hallucinations repeated. Eleven of the 17 channels recommended tour-edge.com, in 91 answers. That domain wasn't registered. The golf brand's actual domain is touredge.com.
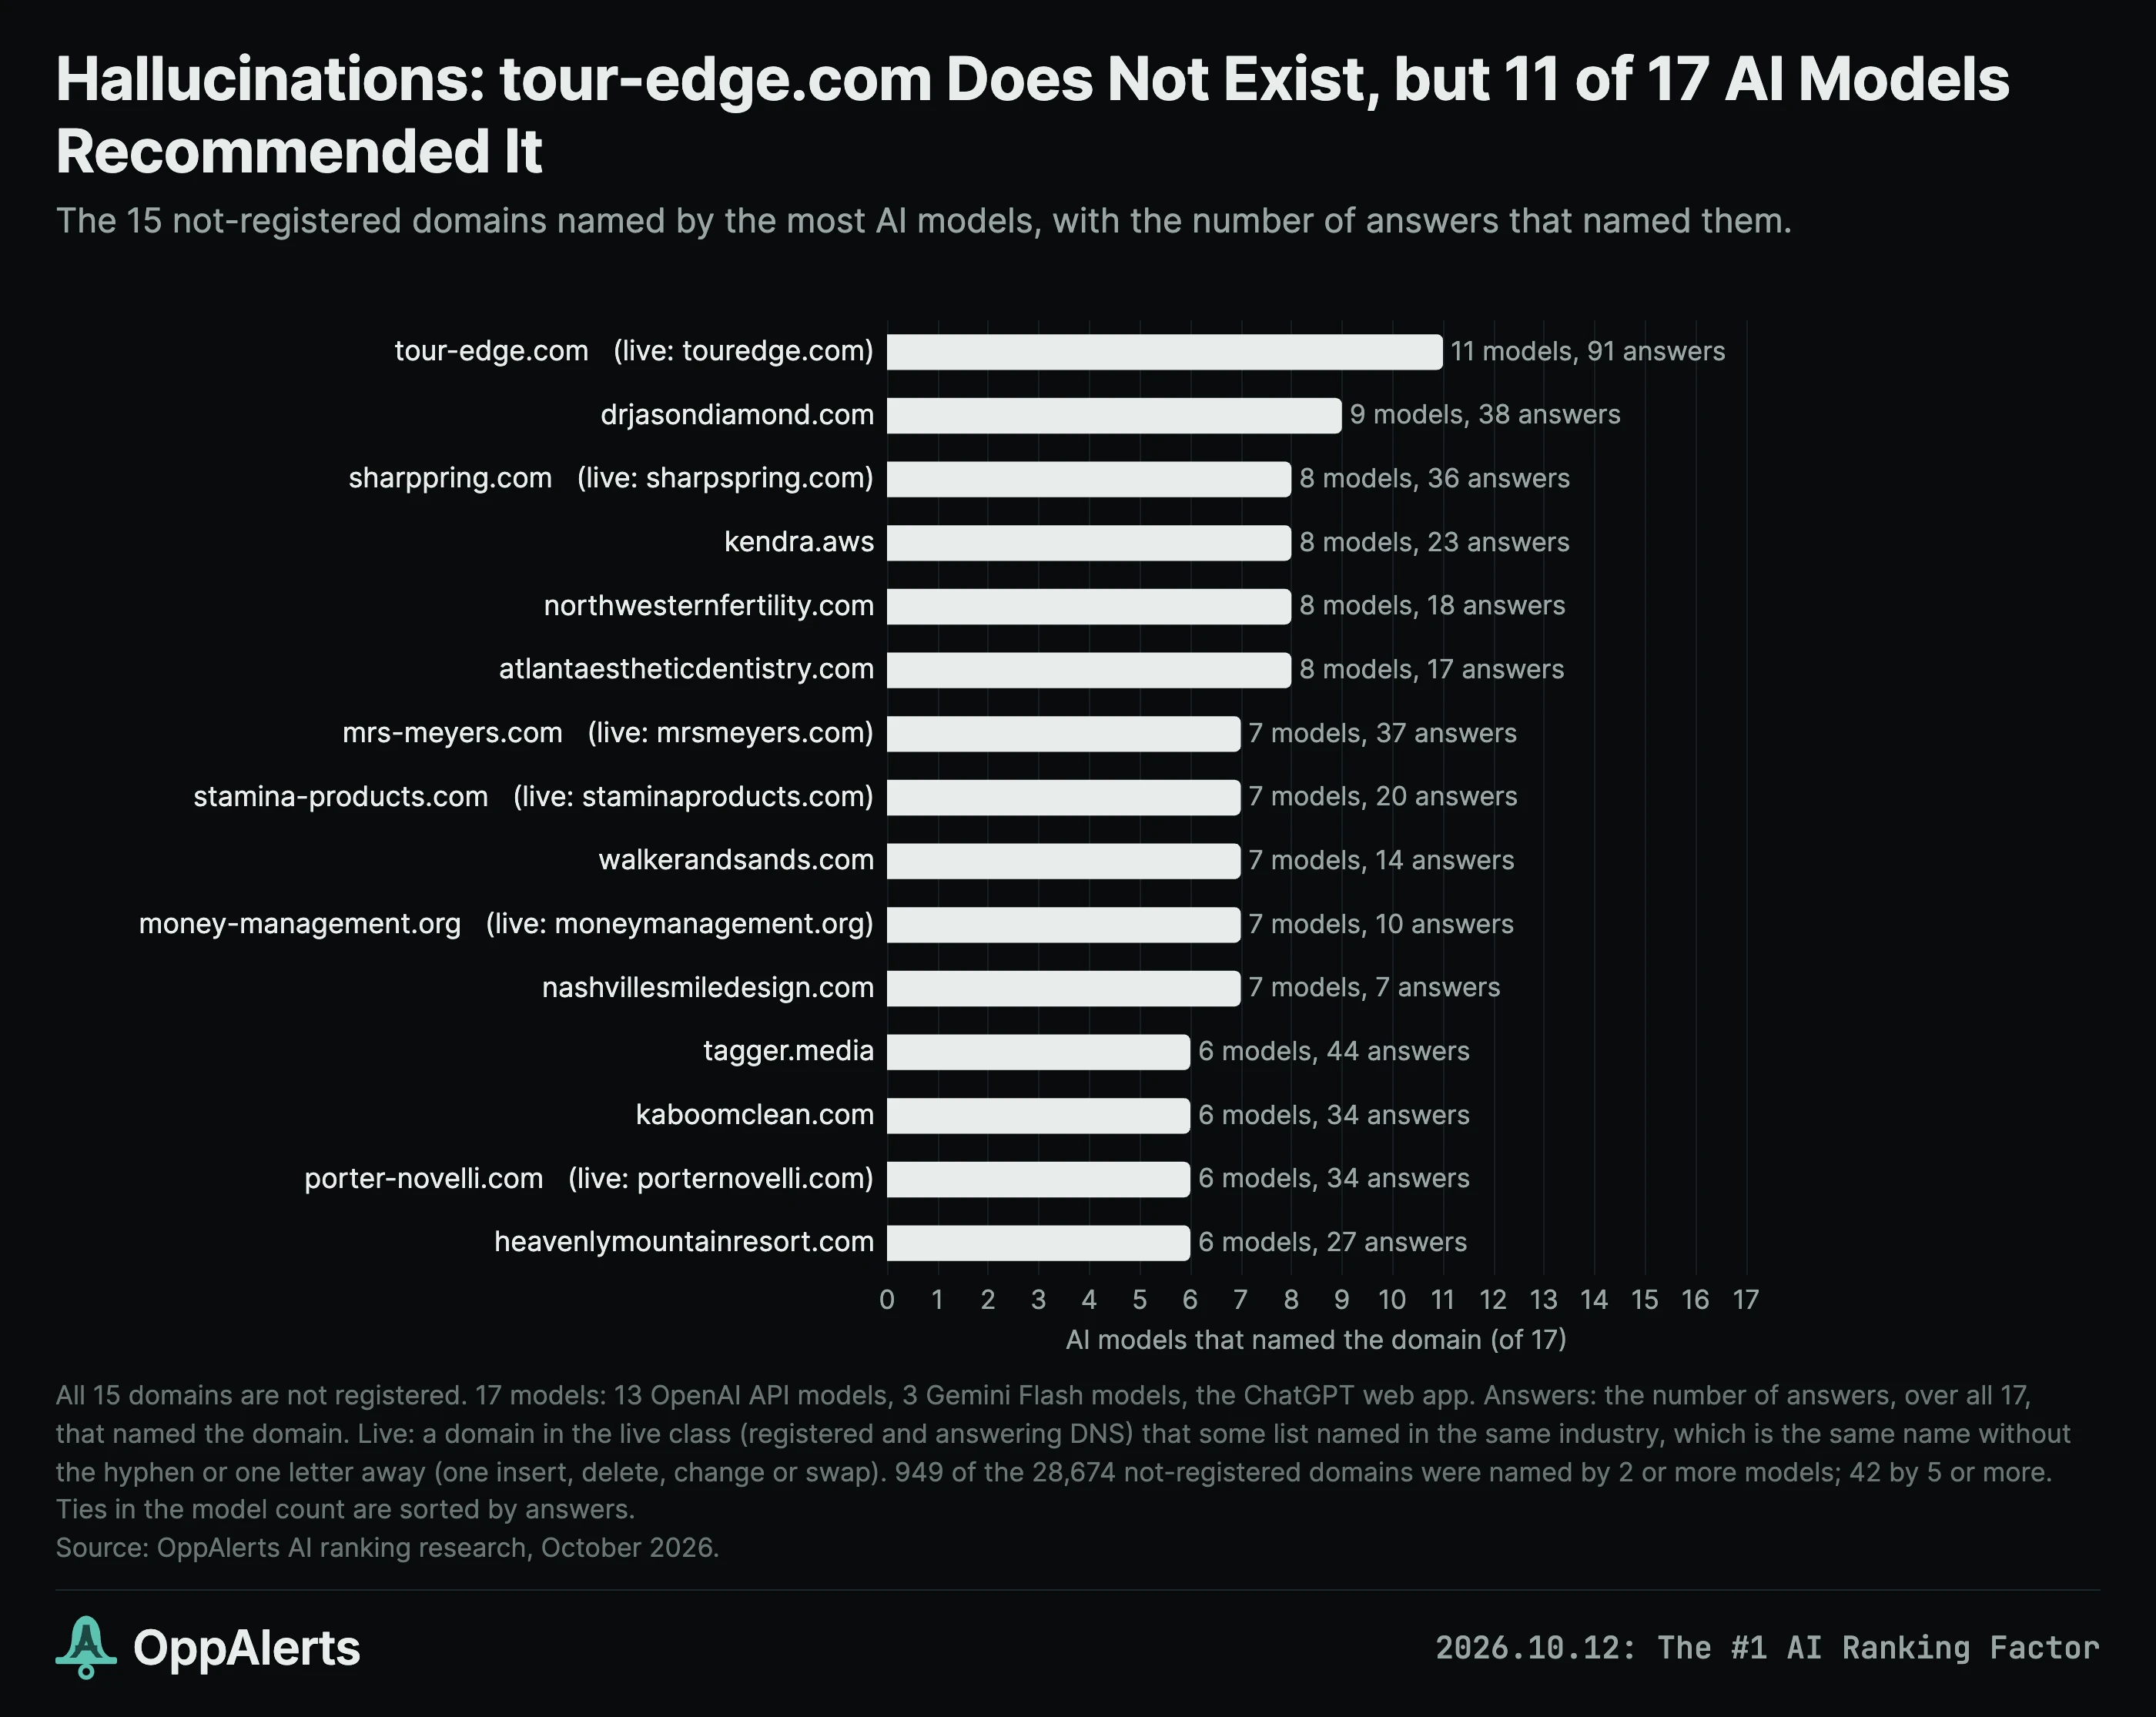
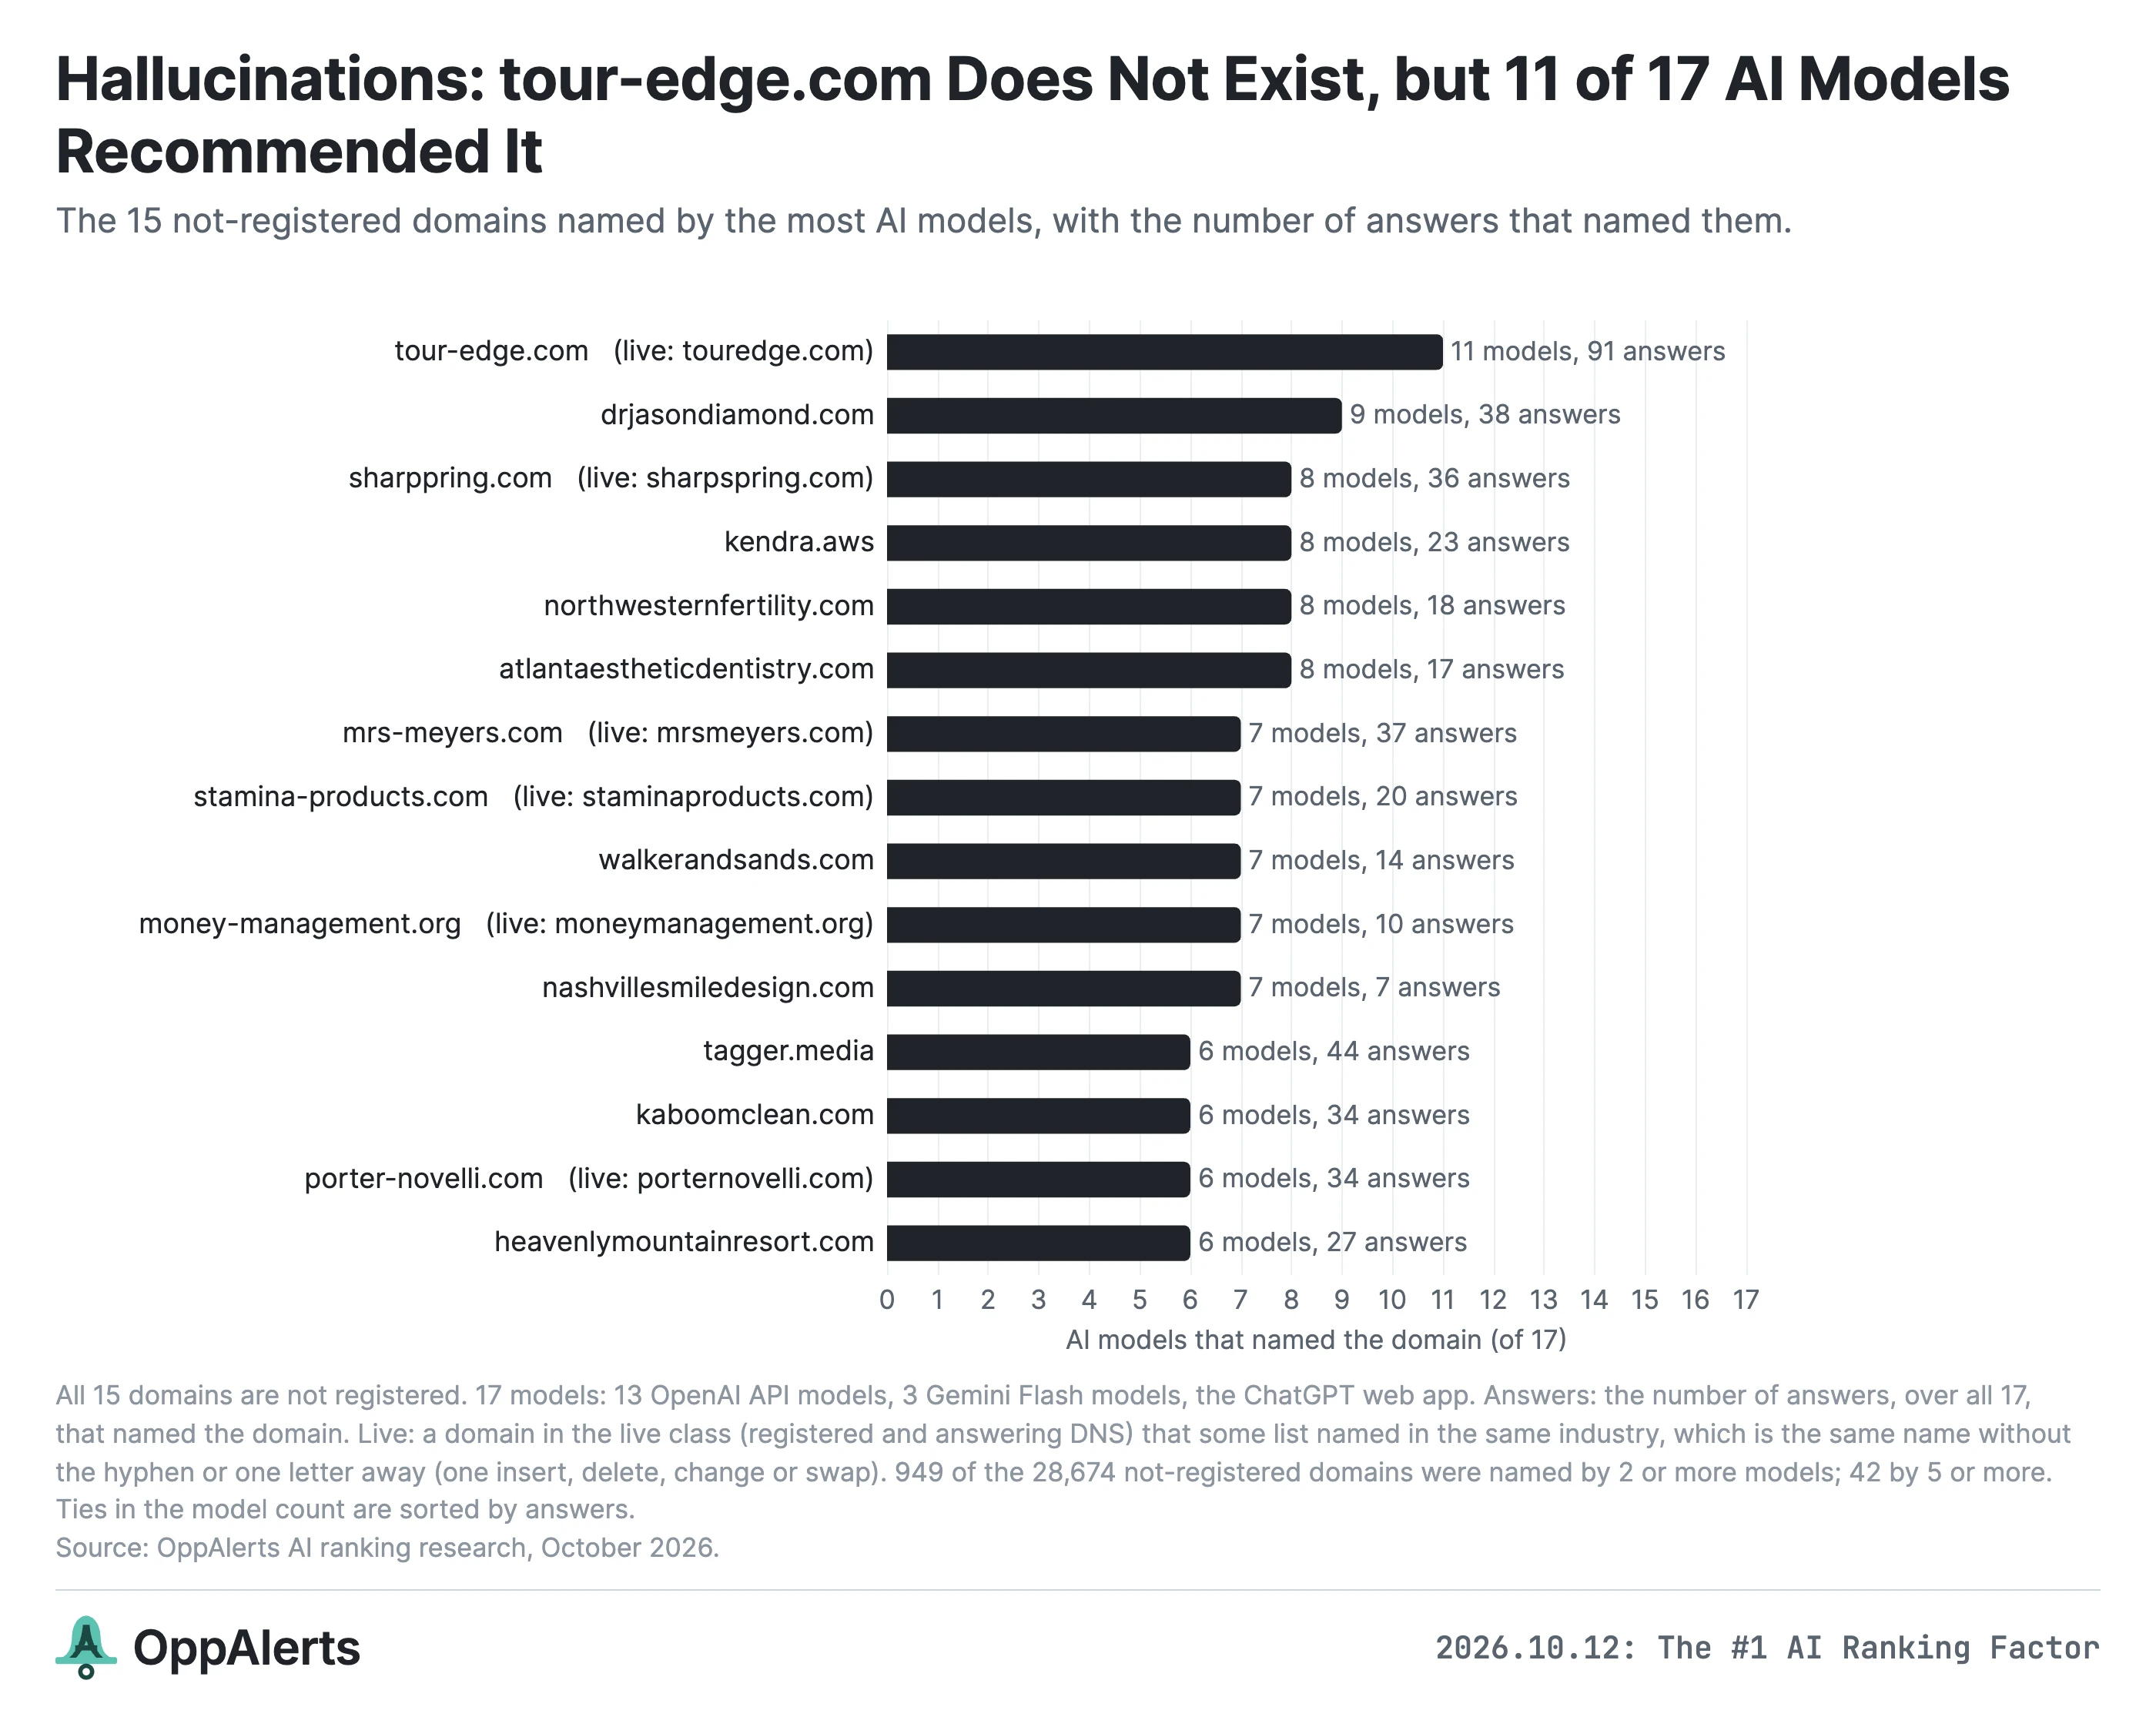
In the newer models, 21% to 38% of hallucinated domains were close to a real domain named in the same industry. Sometimes it was an added hyphen, as in mrs-meyers.com or porter-novelli.com. Sometimes it was a missing character, as in sharppring.com instead of sharpspring.com.
For GPT-6 Sol's B2B ad agency list, the hallucinated stein-ias.com ranked third, while the real steinias.com ranked eighth.
So some of these are real businesses with the wrong URL, which is still a problem for someone trying to find the business.
The industries with fewer relevant backlinks have more hallucinations
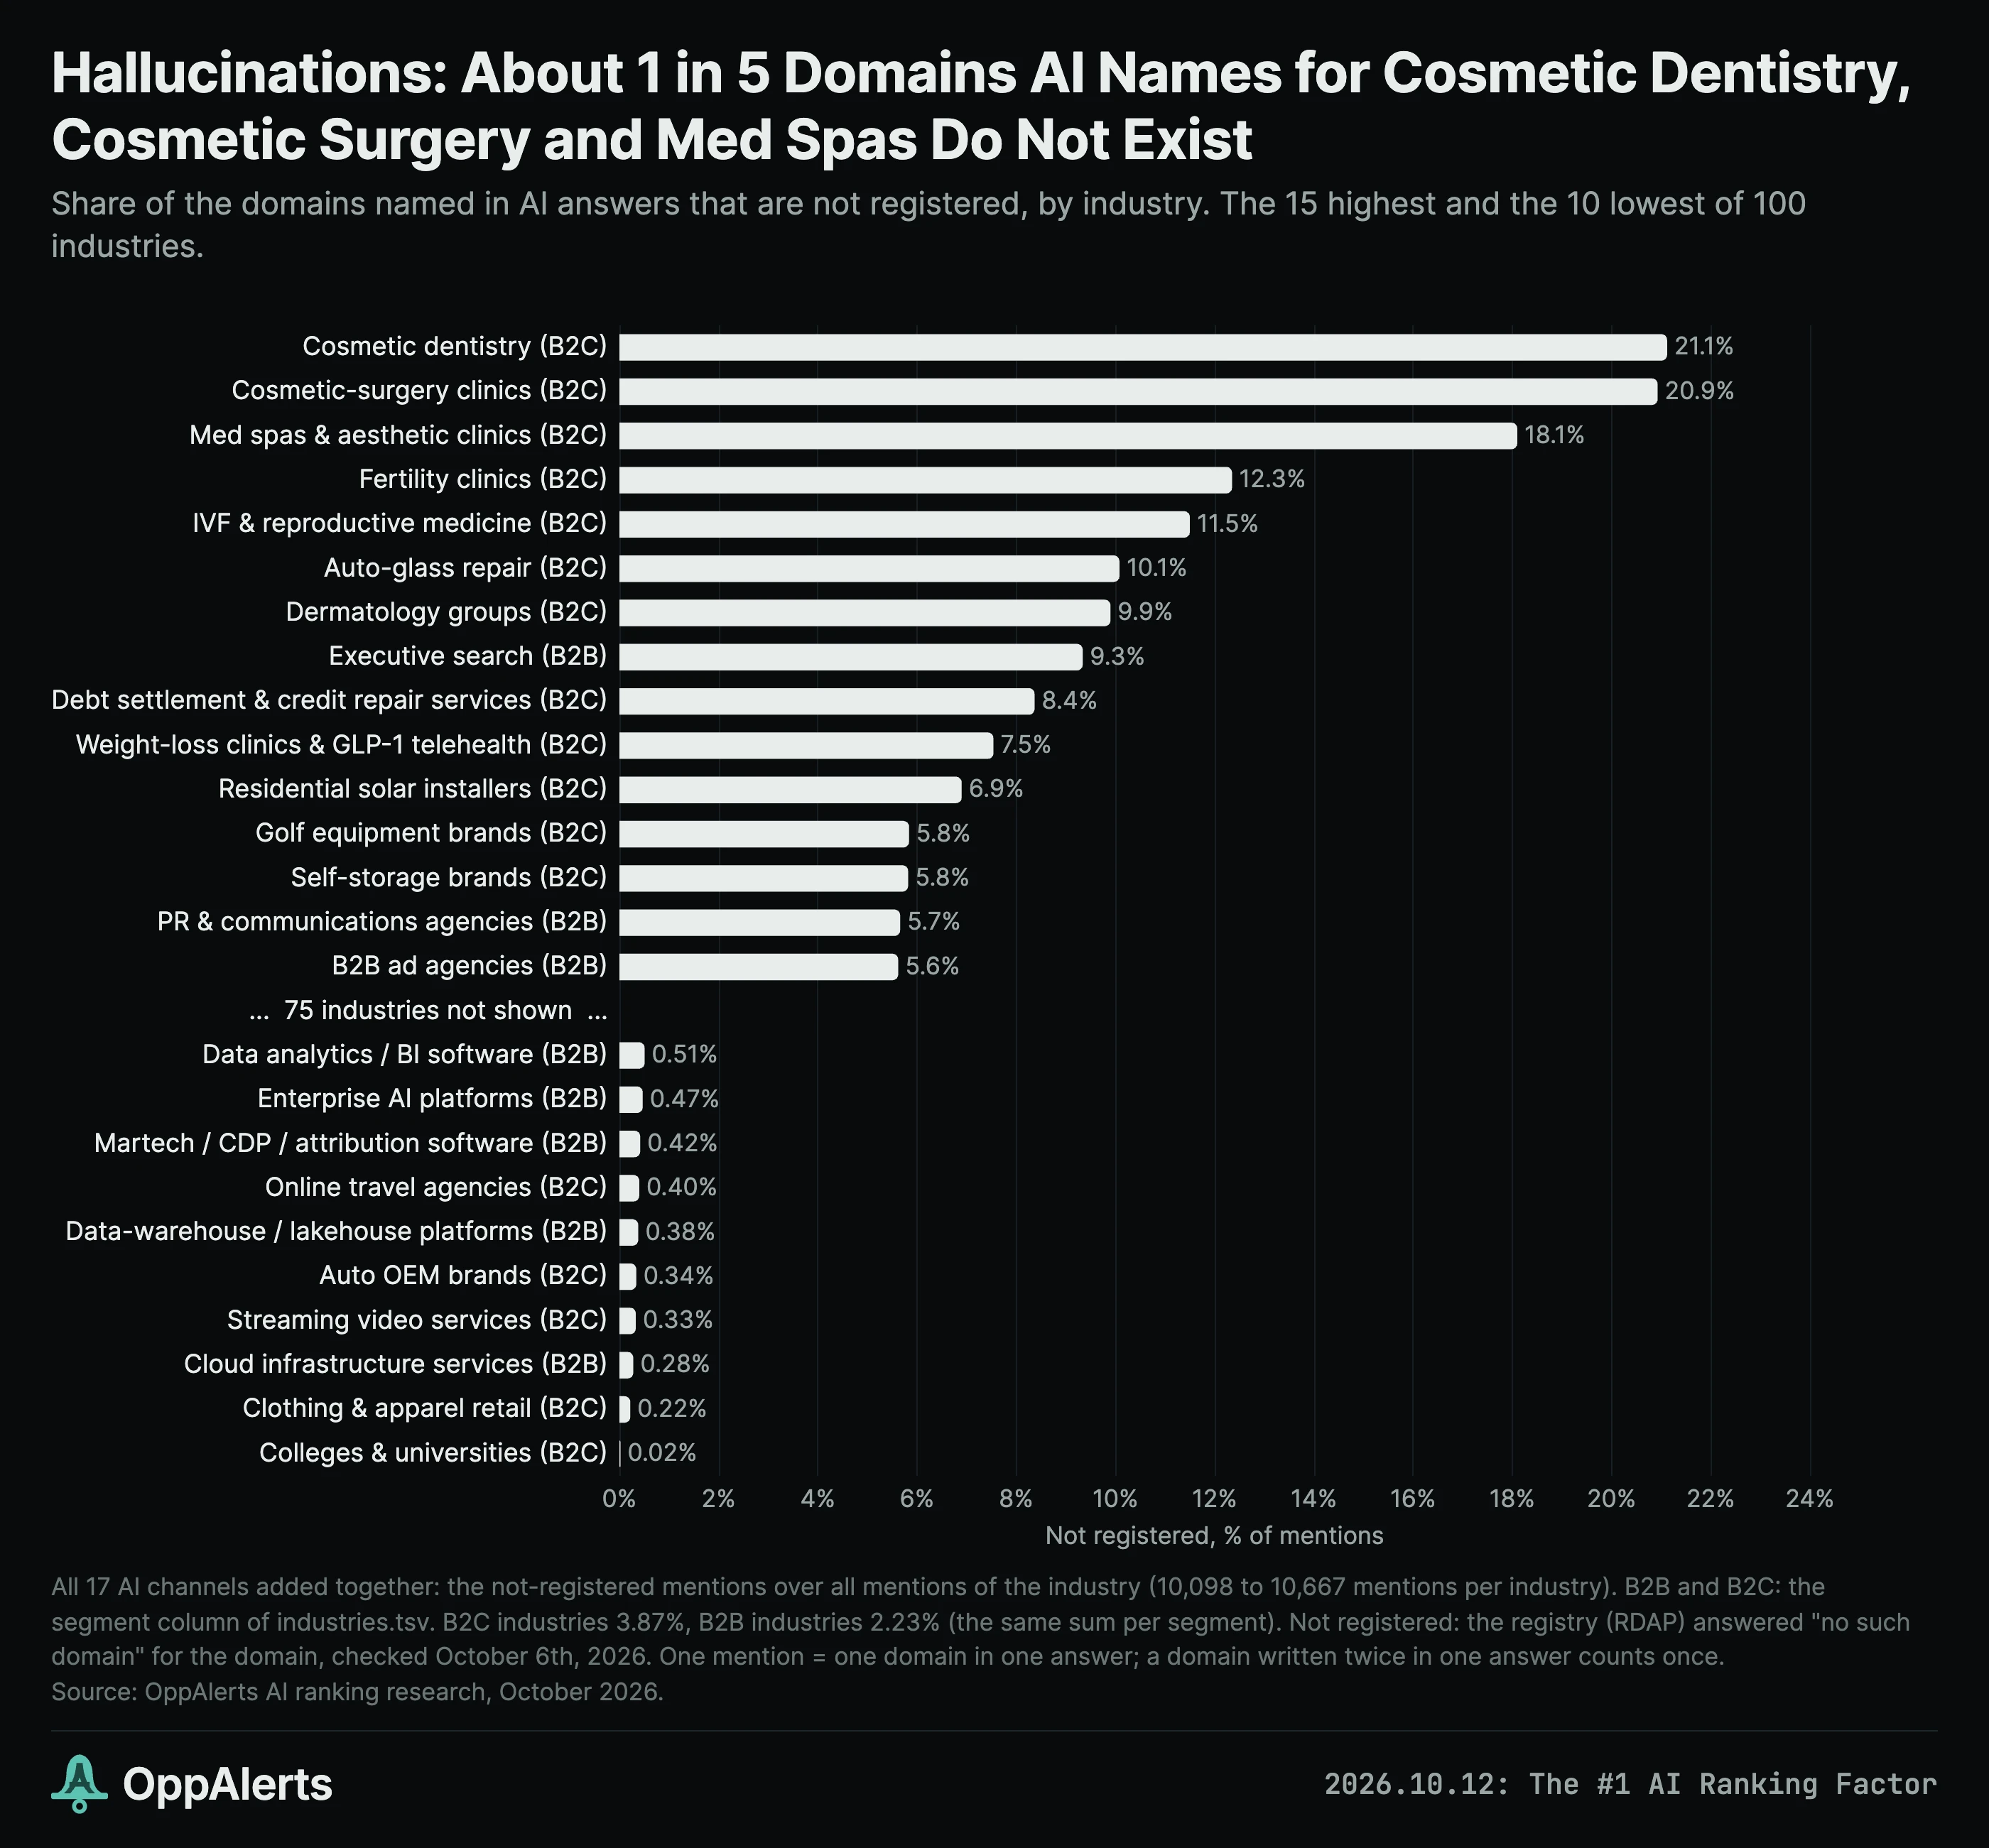
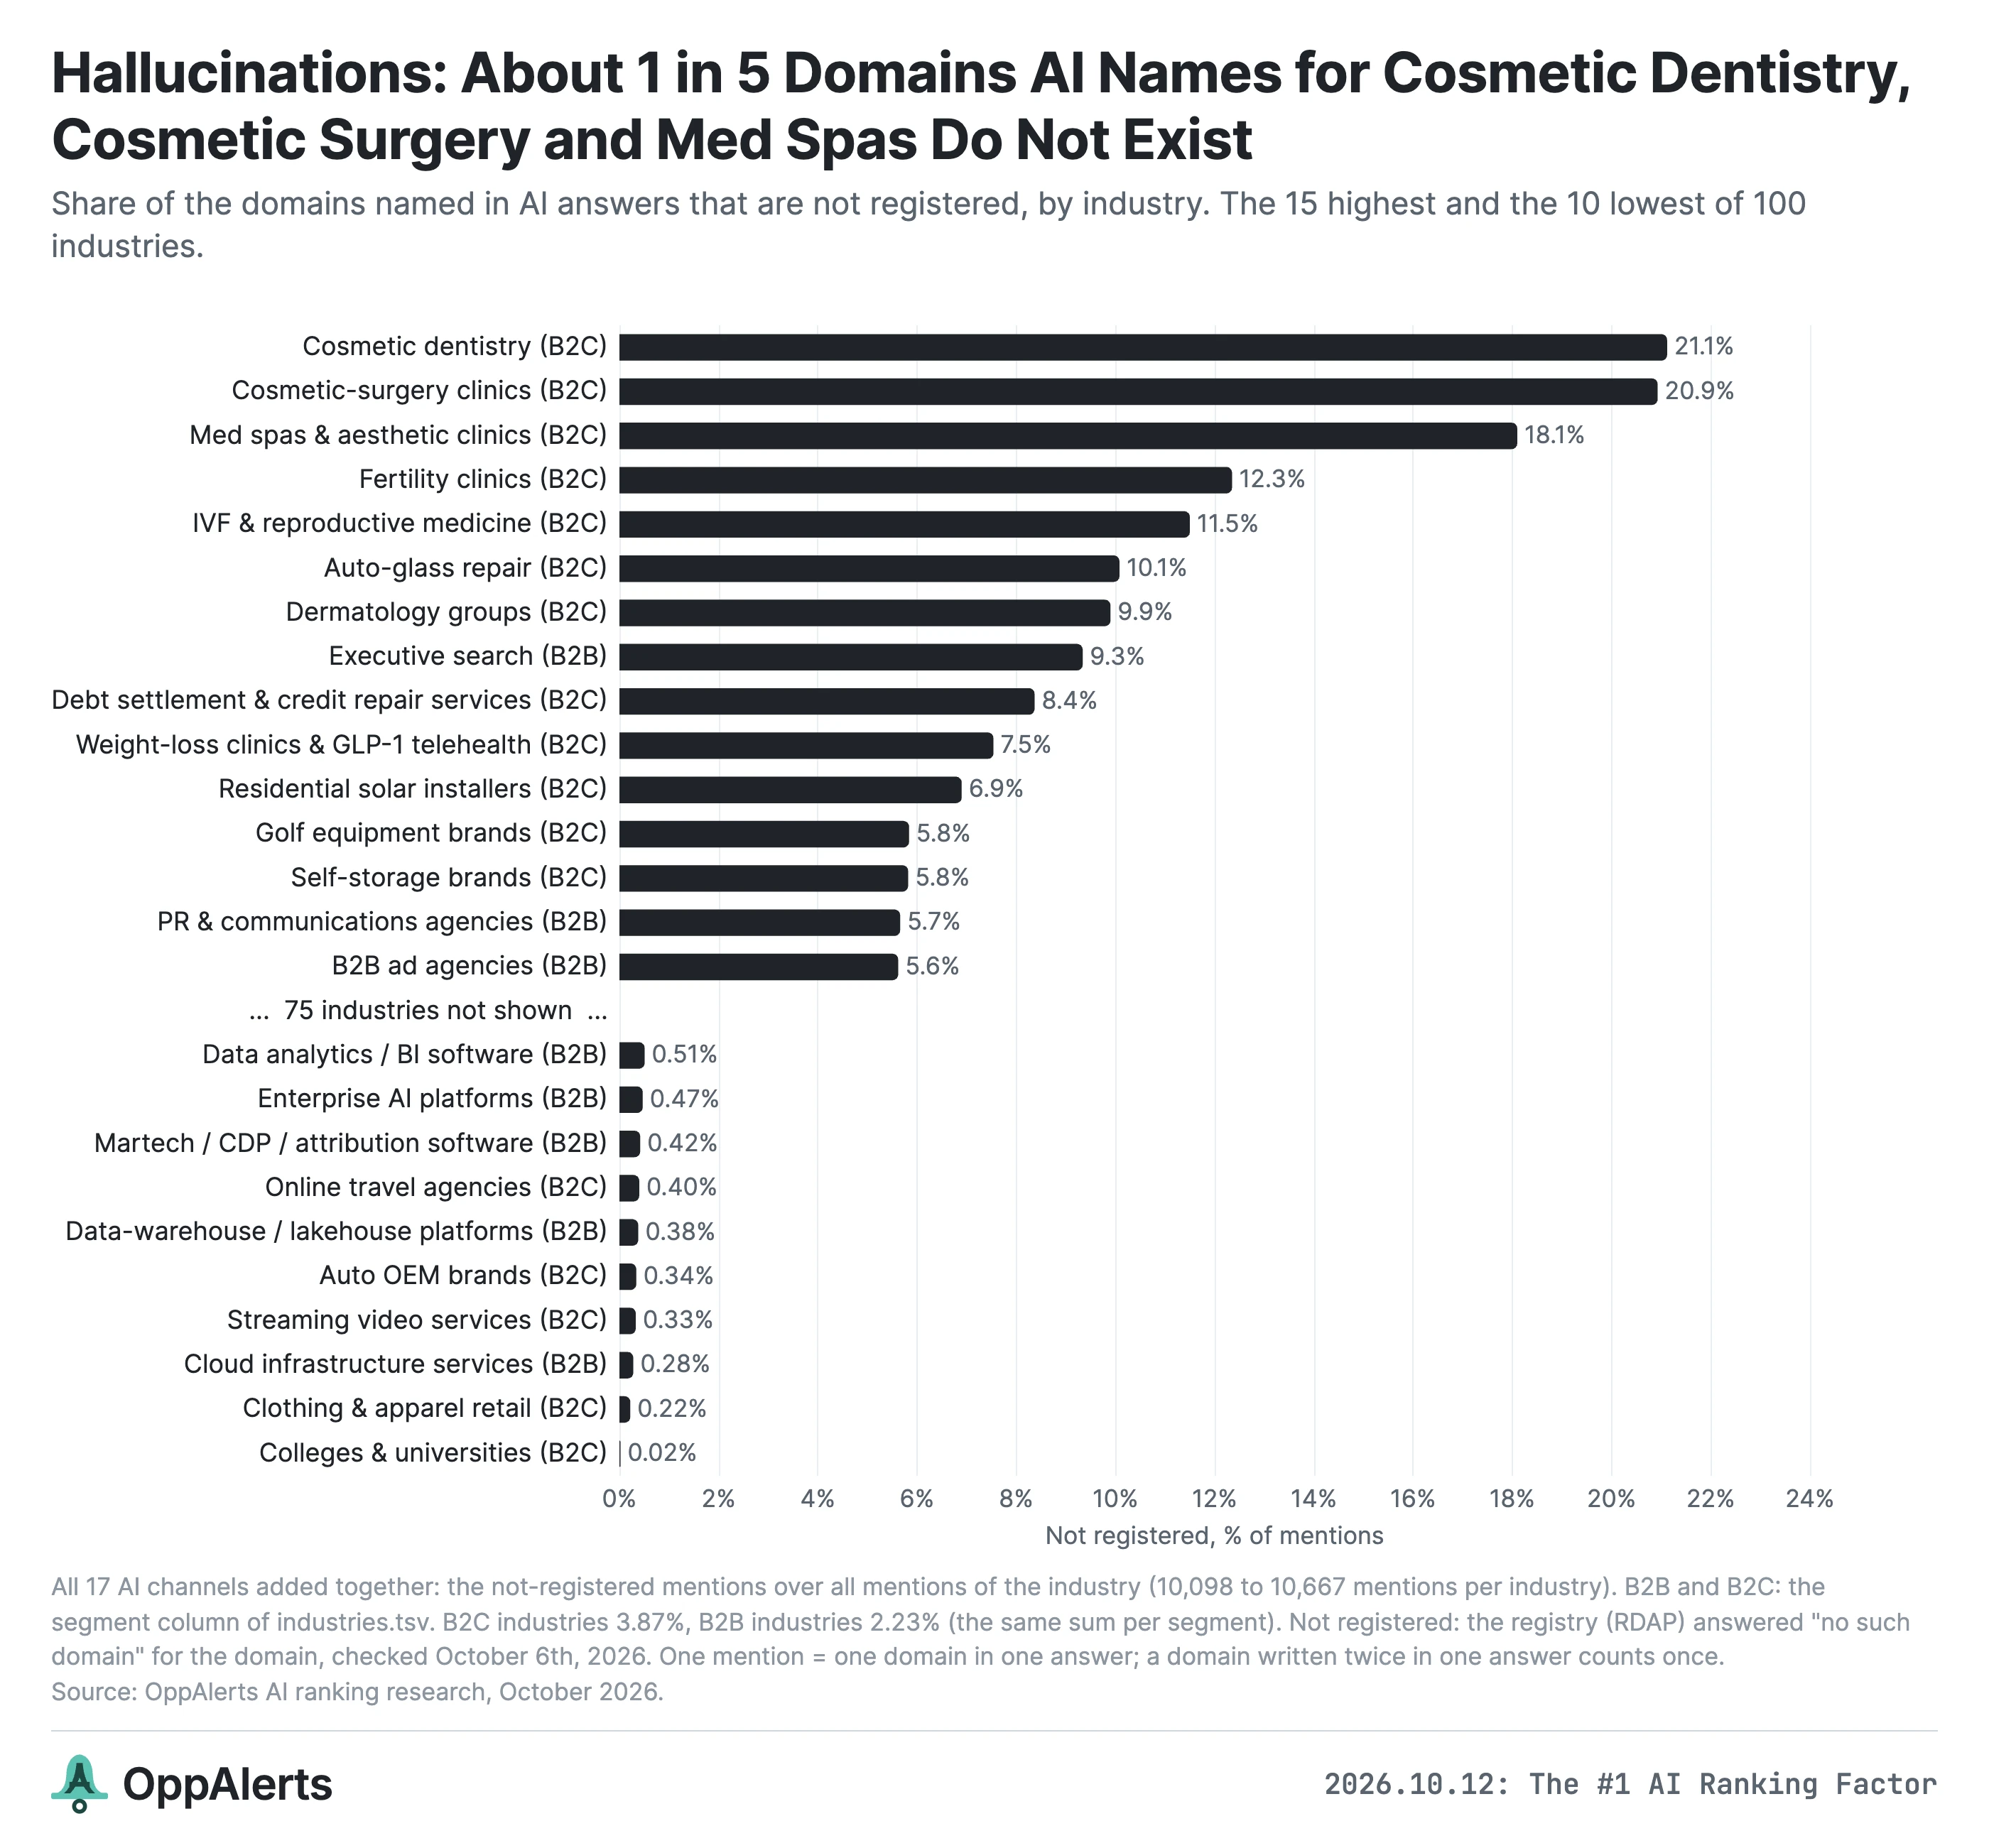
Across all 17 channels, 21.1% of domain recommendations for cosmetic dentistry were unregistered. For cosmetic surgery clinics, it was 20.9%. For med spas, 18.1%.
For colleges and universities, it was 0.02%.
Fertility clinics, IVF, auto-glass repair, and dermatology groups were also among the industries with the most hallucinations.
These are many of the same industries where the top brands have relatively few relevant backlinks in the indexes. Across the 100 industries, the hallucination rate correlates at -0.78 with the relevant backlink count of GPT-6 Astra's top 10, and -0.79 with their PageRank.
That doesn't tell us exactly why a model gets a domain wrong.19 It does show that the hallucinations are concentrated in industries with fewer relevant backlinks in these indexes.
And hallucinated domains aren't the only dead ends. Some domains are registered but parked, for sale, or have no website. Including those, 18.0% of GPT-5 Nano's recommendations led to no business website. GPT-6 Astra was at 0.56%, and Google's organic results at 0.05%.
When you're checking your AI visibility, look at the actual domain being recommended. If models repeatedly add a hyphen or misspell your domain, you may want to register that variant and redirect it.20
Also, measure more than one answer. Repeated prompts and combined scores filter out many of the one-off hallucinations that can make a single result misleading.
The same pattern shows up in both indexes
I've combined the news and prospect indexes in the main charts, but I also wanted to know whether one was responsible for the pattern.
For GPT-6 Astra, link counts from the prospect index correlate with AI score at 0.55. The news index is at 0.49. Both are positive in all 100 industries.
For unlinked mentions, they're almost equal: 0.41 for the prospect index and 0.40 for the news index.
The balance between them depends on the industry. Across industries, the news index holds a median of 24% of the backlinks for the top 25 brands.
That's only 4% for media-buying agencies, and 6% for B2B ad agencies and SEO and content-marketing agencies. It's 59% for healthcare IT, 55% for streaming video services, and 48% for jewelry, luggage, and leather goods retail.
Both indexes show the relationship. They also give you access to different kinds of opportunities, depending on the business you're promoting.
The type of opportunity tells us less than I expected
OppAlerts also classifies pages by the kinds of opportunities they offer.
An opportunity type describes something you might be able to do: contribute a guest post, appear on a resource page, participate in an event, arrange a sponsorship, etc.
A content type describes what the page is: a how-to article, an industry report, a case study, and so on.
There are 79 opportunity types in 15 groups, plus 18 content types. That gave me another thing to test.
Here's the full list:
| Group | Opportunity types |
|---|---|
| Advertising | Advertise with us, Banner ads, Native and in-content, Newsletter ads, Podcast ads, Sponsored content, Video ads |
| Audio and video | Web shows, Podcast guesting, Podcasts, Radio shows, Television programs, Video collaborations, Webinar series, YouTube channels |
| Awards | Submissions, Awards lists |
| Commerce | Buyer guides, Comparisons and alternatives, Product review pitch |
| Community | AMA and Q&A, Blog commenting, Community submissions, Forums |
| Content | Listicle inclusion, Collaboration, Guest posts, Infographics, Quizzes, Slide decks, Testimonials, User-generated content |
| Directories | Association member listings, Business directories, Link directories, Software and tool directories, Vendor and supplier directories |
| Events | Award ceremonies, Calls for papers, Conferences and trade shows, Event calendars, Event sponsorships, Expos and booths, Meetups, Roundtables, Speaker proposals |
| Experts | Expert directories, Roundups and panels, Interviews |
| Links | Blogrolls, Link exchange, Link roundups, Resource pages, Wiki contributions |
| Media | Blogs, Publishers and news sites, Newsletters, Newspapers and business press, Newsrooms and press centers, Op-eds, Press release distribution, Magazines |
| Organizations | Advocacy groups, Local chapters, Nonprofits, Trade associations |
| Partnerships | Affiliate and referral programs, Ambassadors and influencers, Strategic partnerships, Media partnerships, Merchandise collabs, Research partnerships |
| Philanthropy | Corporate giving, Donations, Fundraisers, Grants |
| Sponsorship | Contests and giveaways, Community sponsorships, Sponsors |
| Content types | ||
|---|---|---|
| Academic journals | Analysis and opinion | Best practices and guides |
| Blogs | Books | Case studies |
| Certifications | Courses and training | FAQs and Q&A |
| Glossaries | How-to articles | Industry reports |
| Resource lists | Statistics | Templates and checklists |
| Tools and calculators | Trends and forecasts | White papers and ebooks |
When you search the OppAlerts indexes, you can search for these opportunity and content types directly. For example, you can look for guest posts, sponsored content, or product review opportunities on sites with a PageRank of at least 20, then sort the results by how semantically similar each page is to your business.
After accounting for the number of backlinks a brand has, its mix of opportunity and content types has very little relationship with its AI rank.
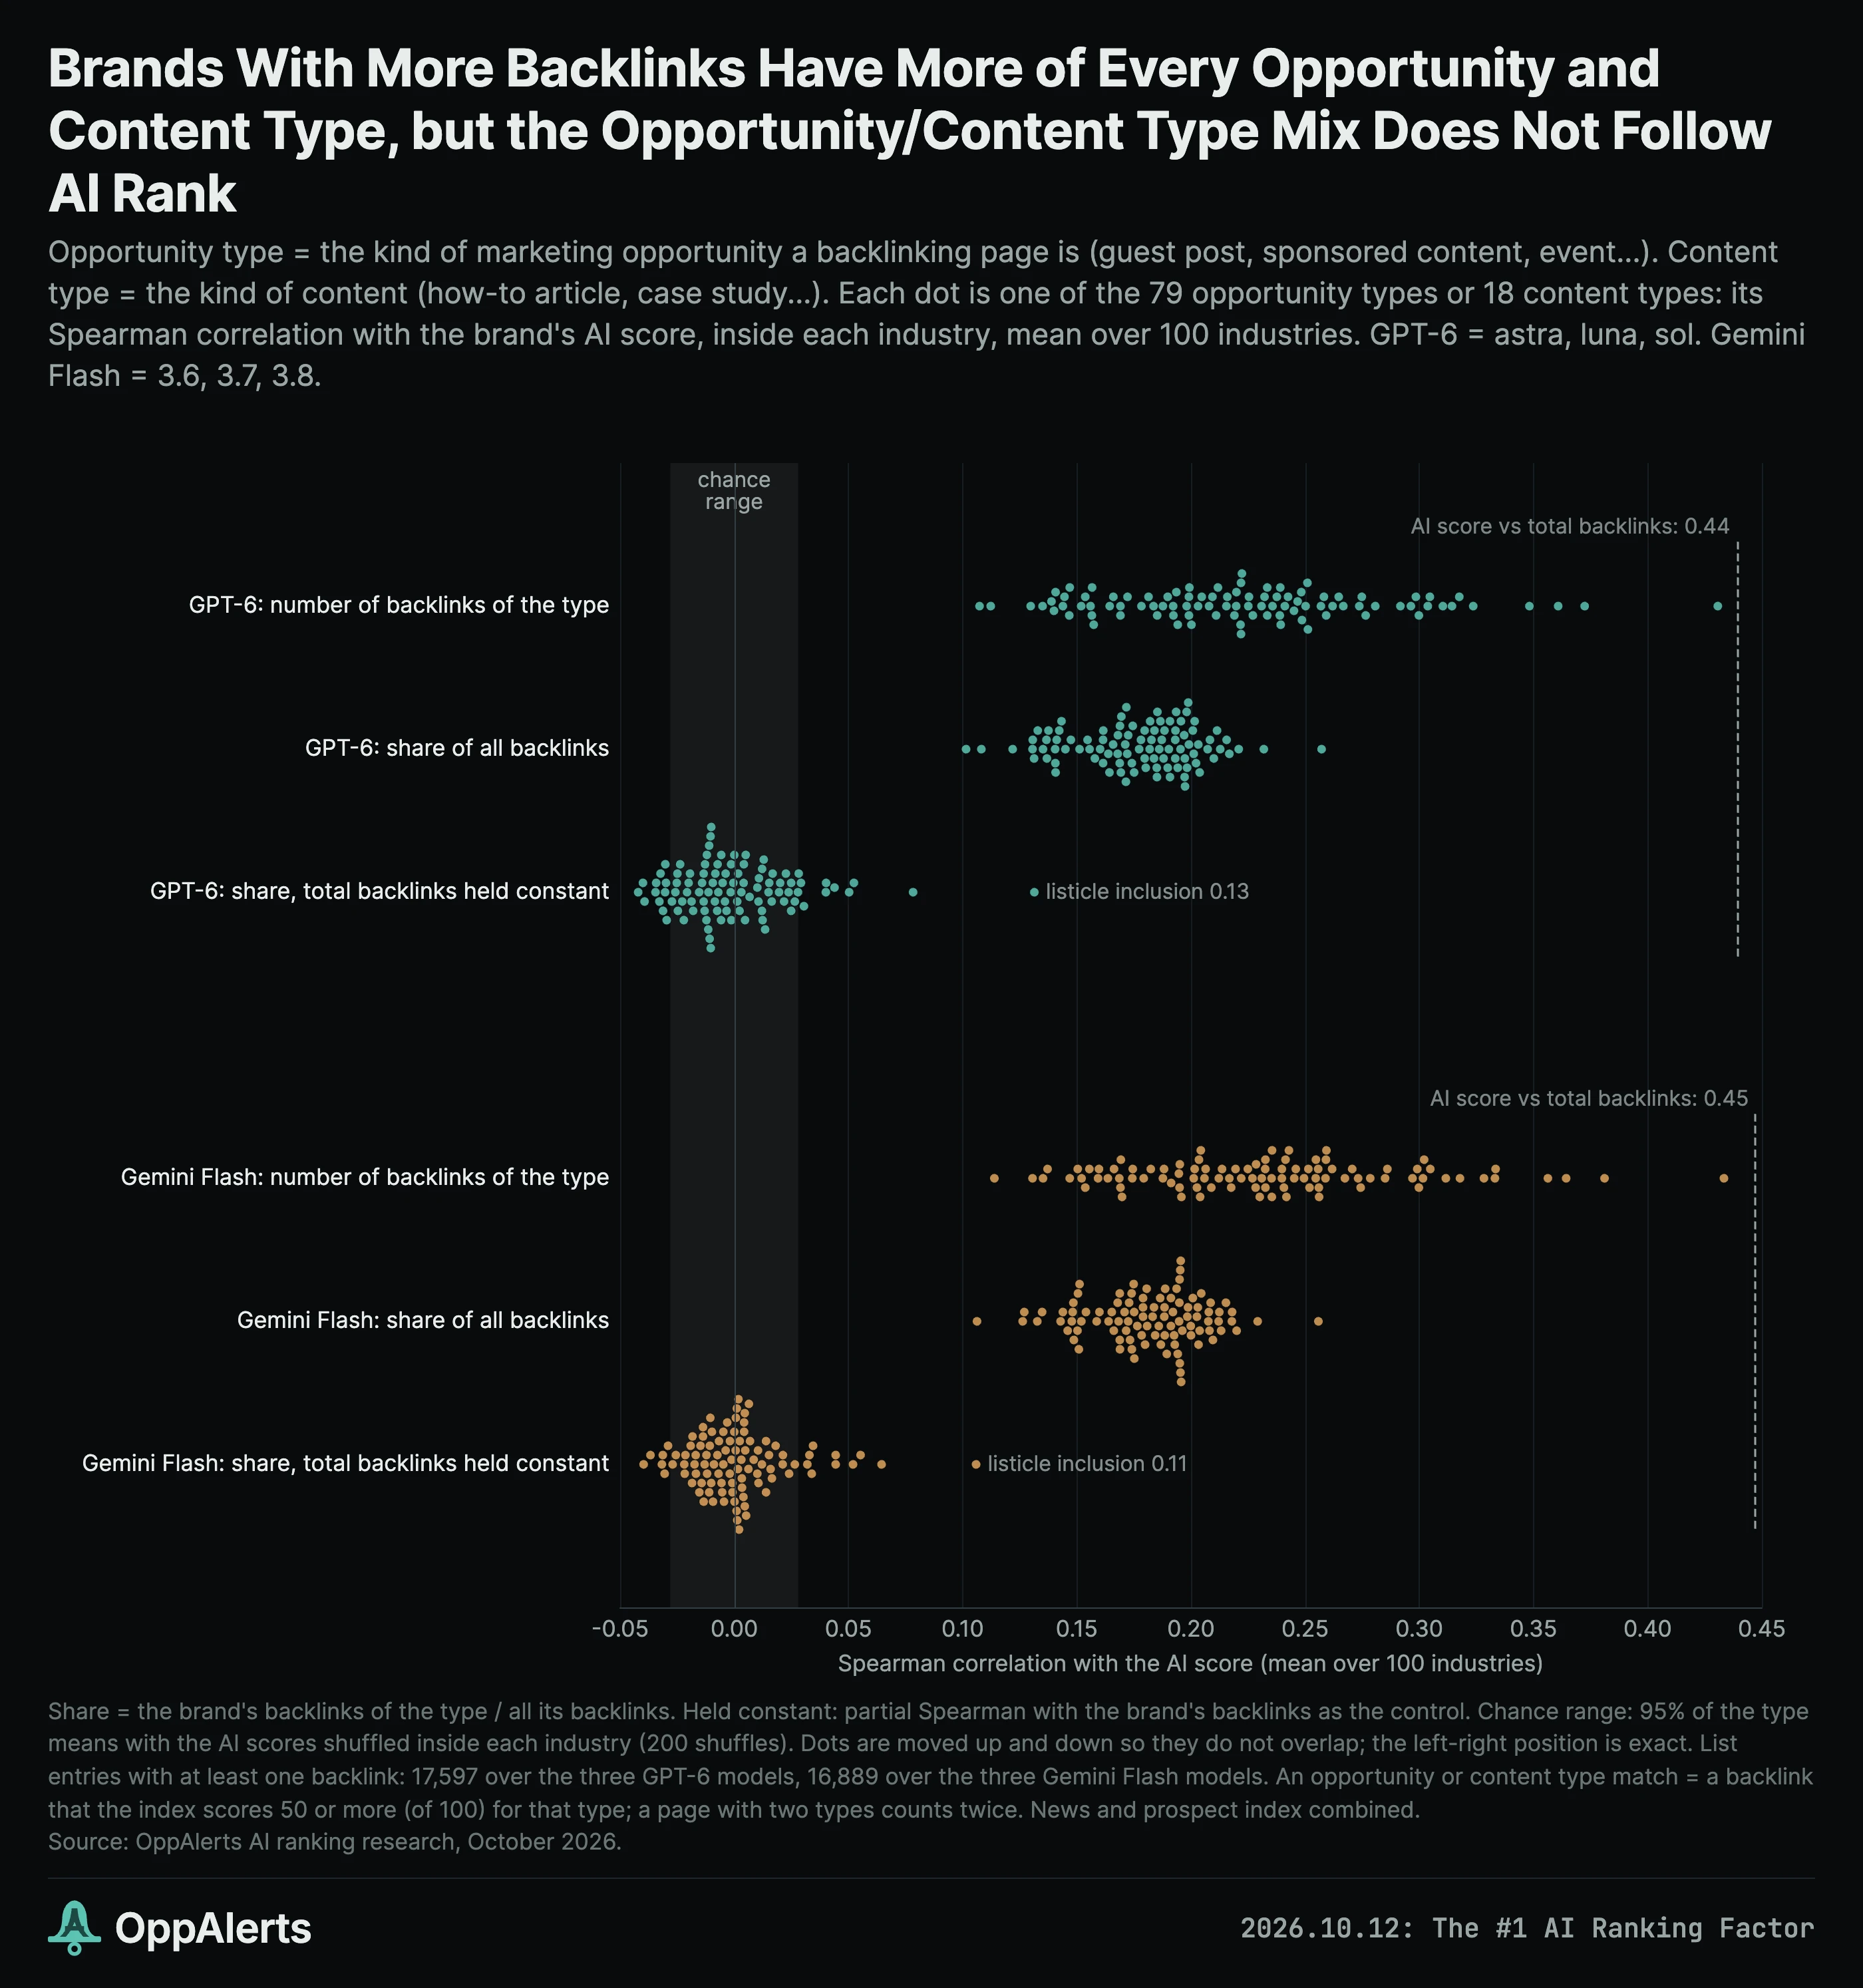
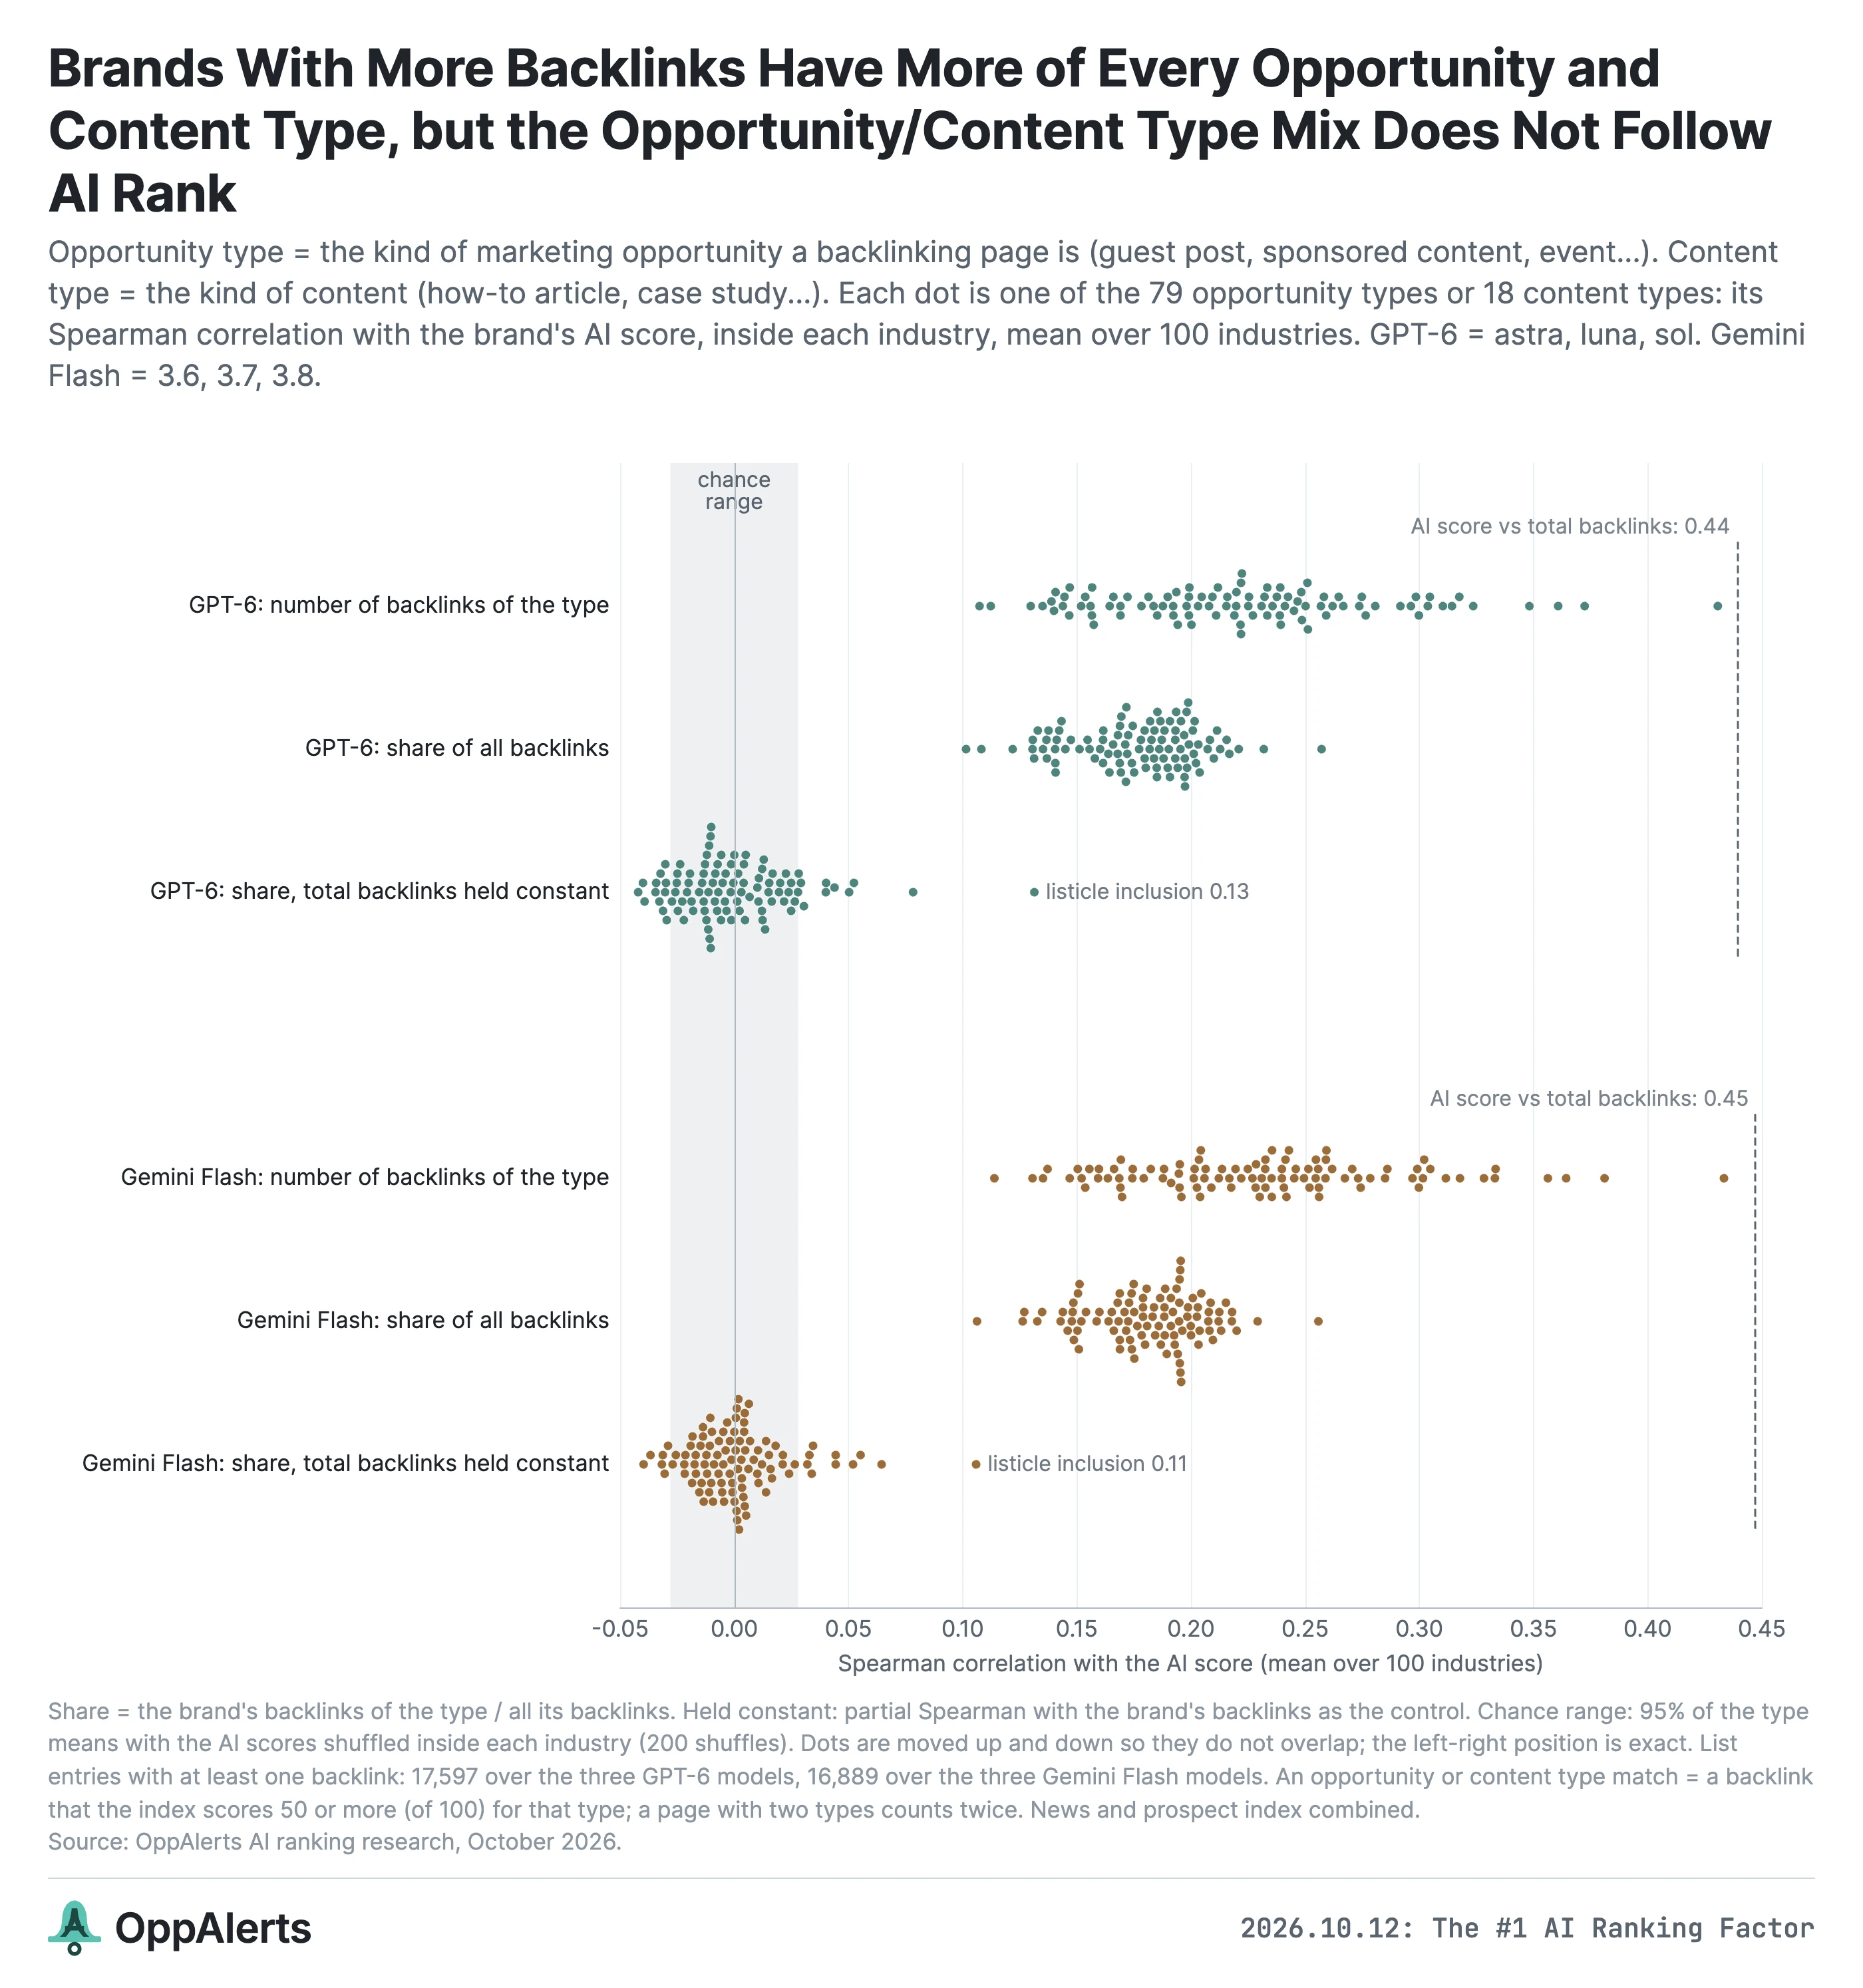
Larger brands have more backlinks of almost every opportunity and content type. Averaged across all 97 opportunity and content types, those counts correlate with AI score at 0.22 for GPT-6 and 0.23 for Gemini Flash. Every one of the 97 has a positive correlation. Total backlink count in that comparison is 0.44.
But smaller brands are missing most opportunity and content types entirely. For brands with 1 to 99 backlinks, 97% of the combinations of brand and opportunity or content type have no backlinks.
Once I account for total backlink count, the average correlation for the share of each opportunity or content type is 0.000 for GPT-6 and 0.001 for Gemini Flash. Of the 97 opportunity and content types, 96 are within 0.10 of zero.
The small exception is listicle inclusion: pages that include the brand among a set of recommended options. That's 0.13 for GPT-6 and 0.11 for Gemini Flash, positive in all six models. Industry reports are next at 0.08 and 0.07.
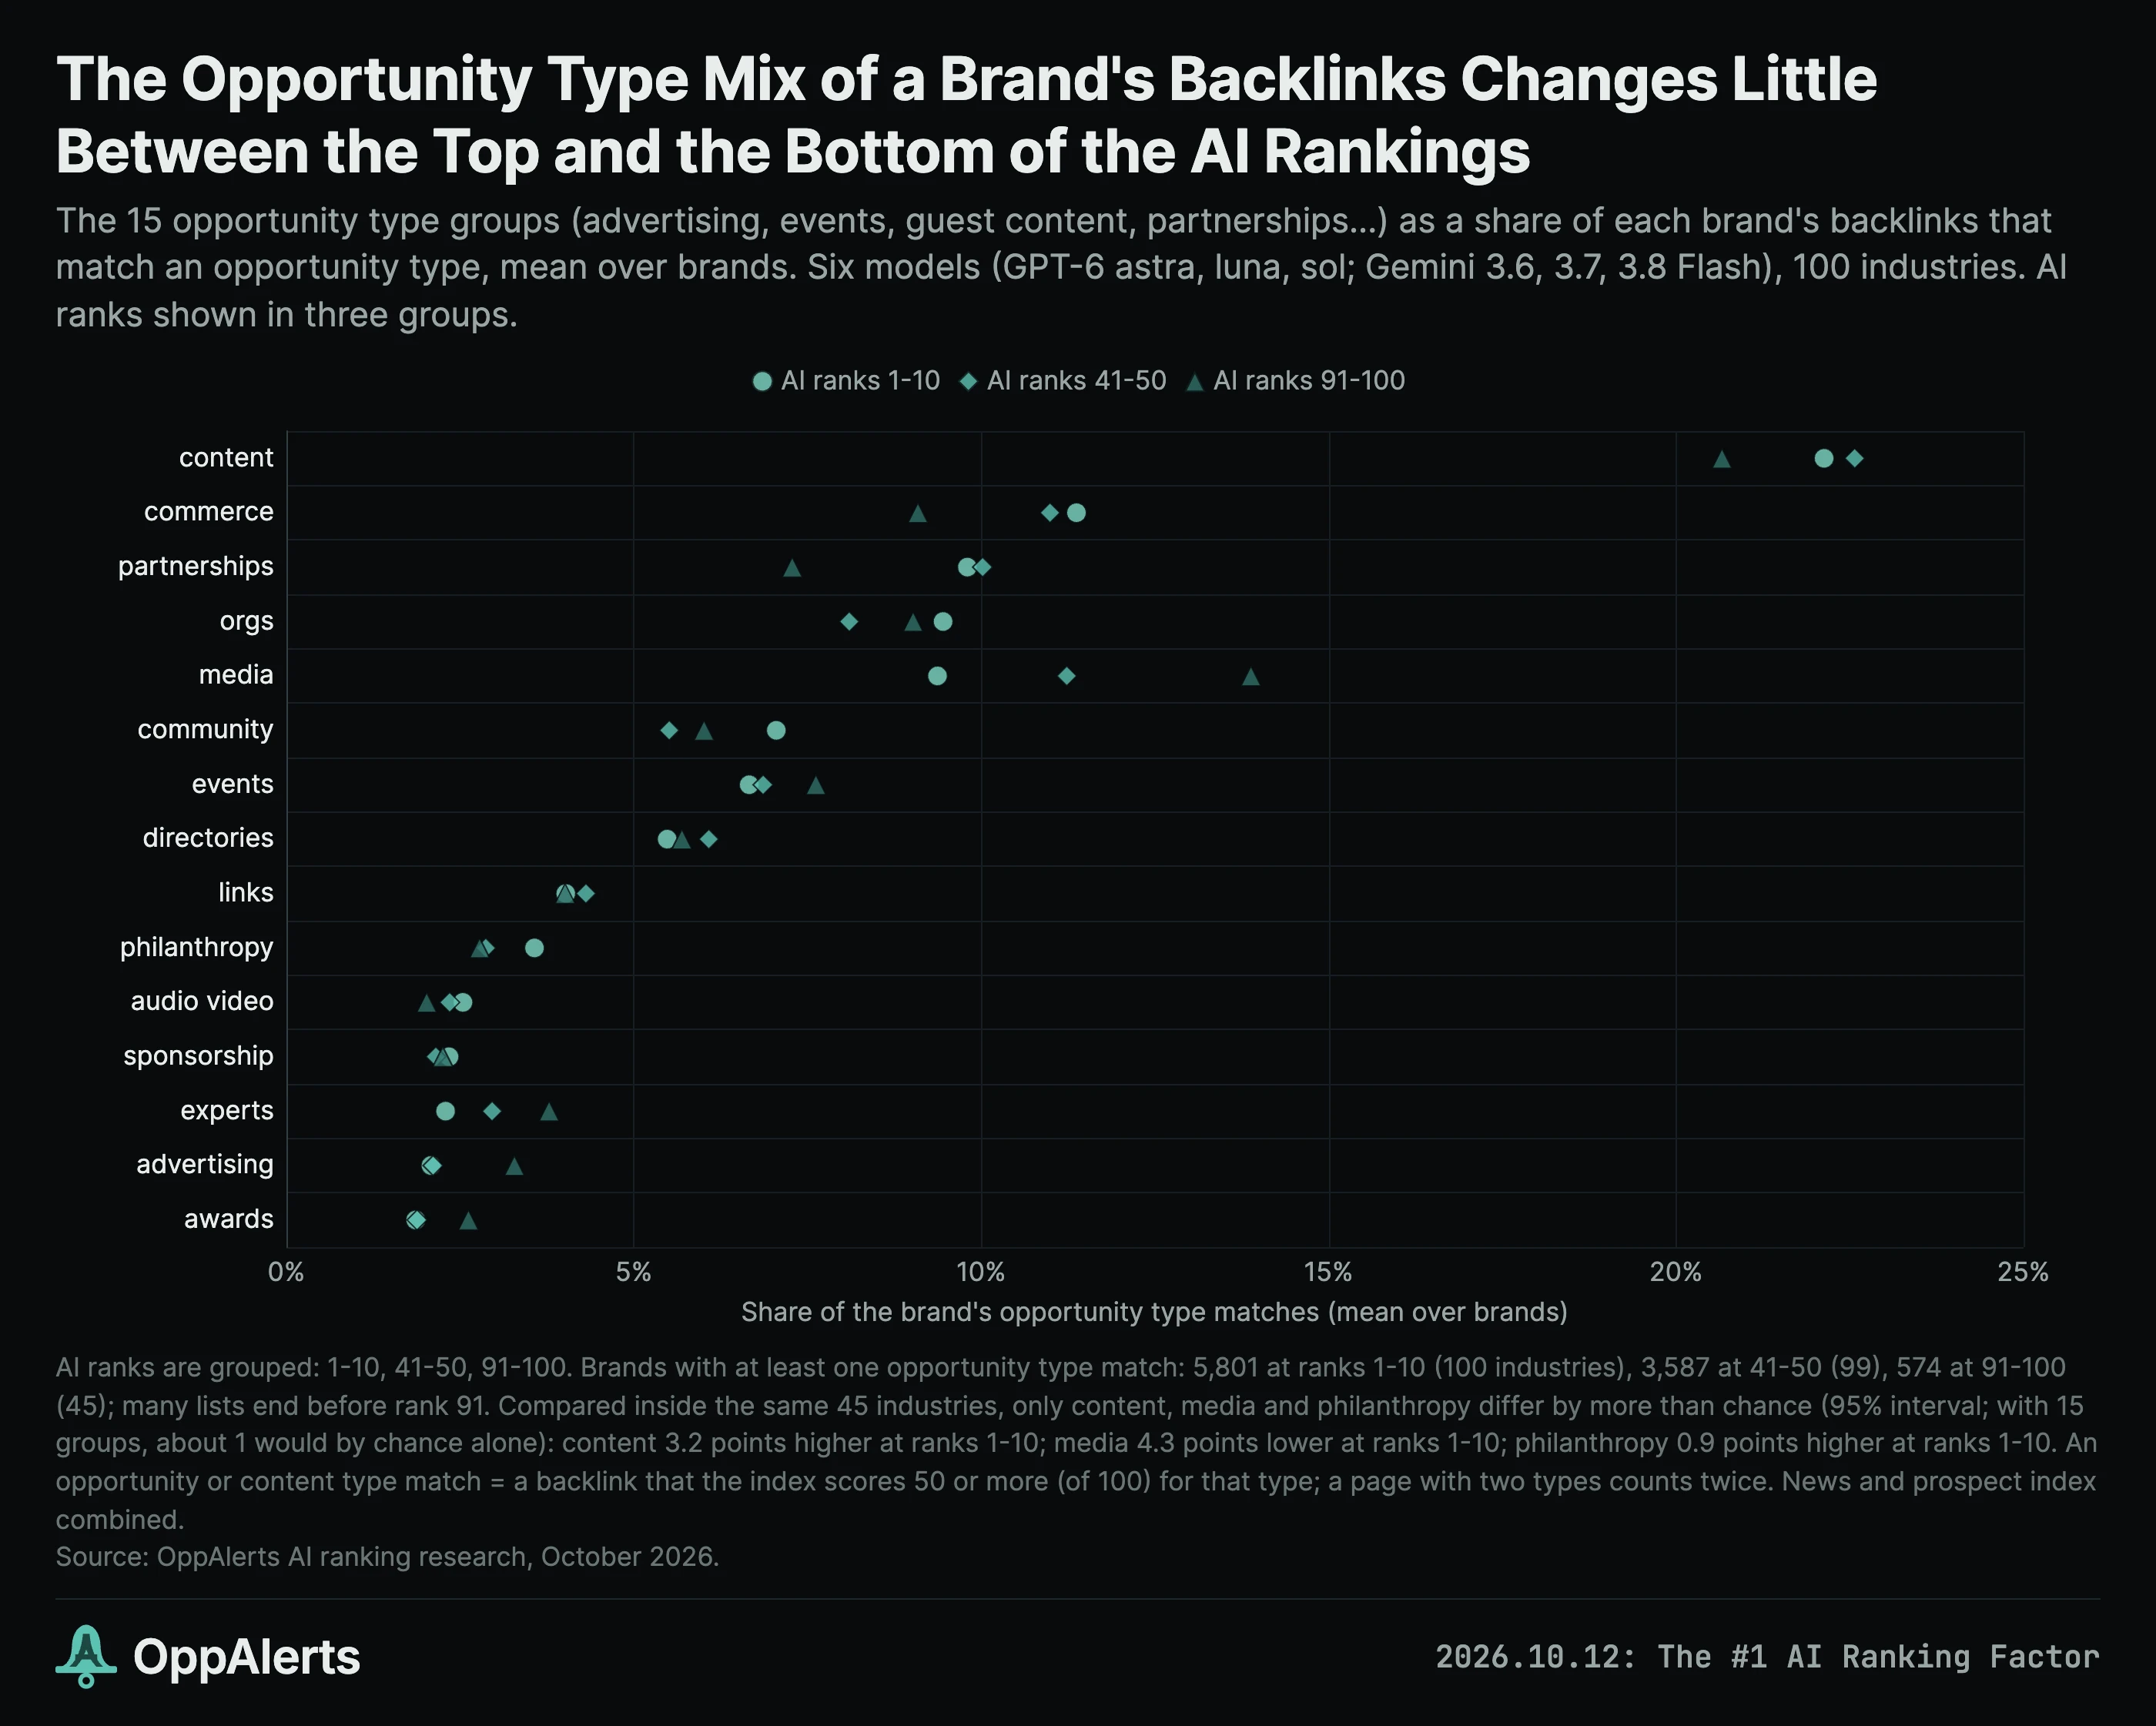
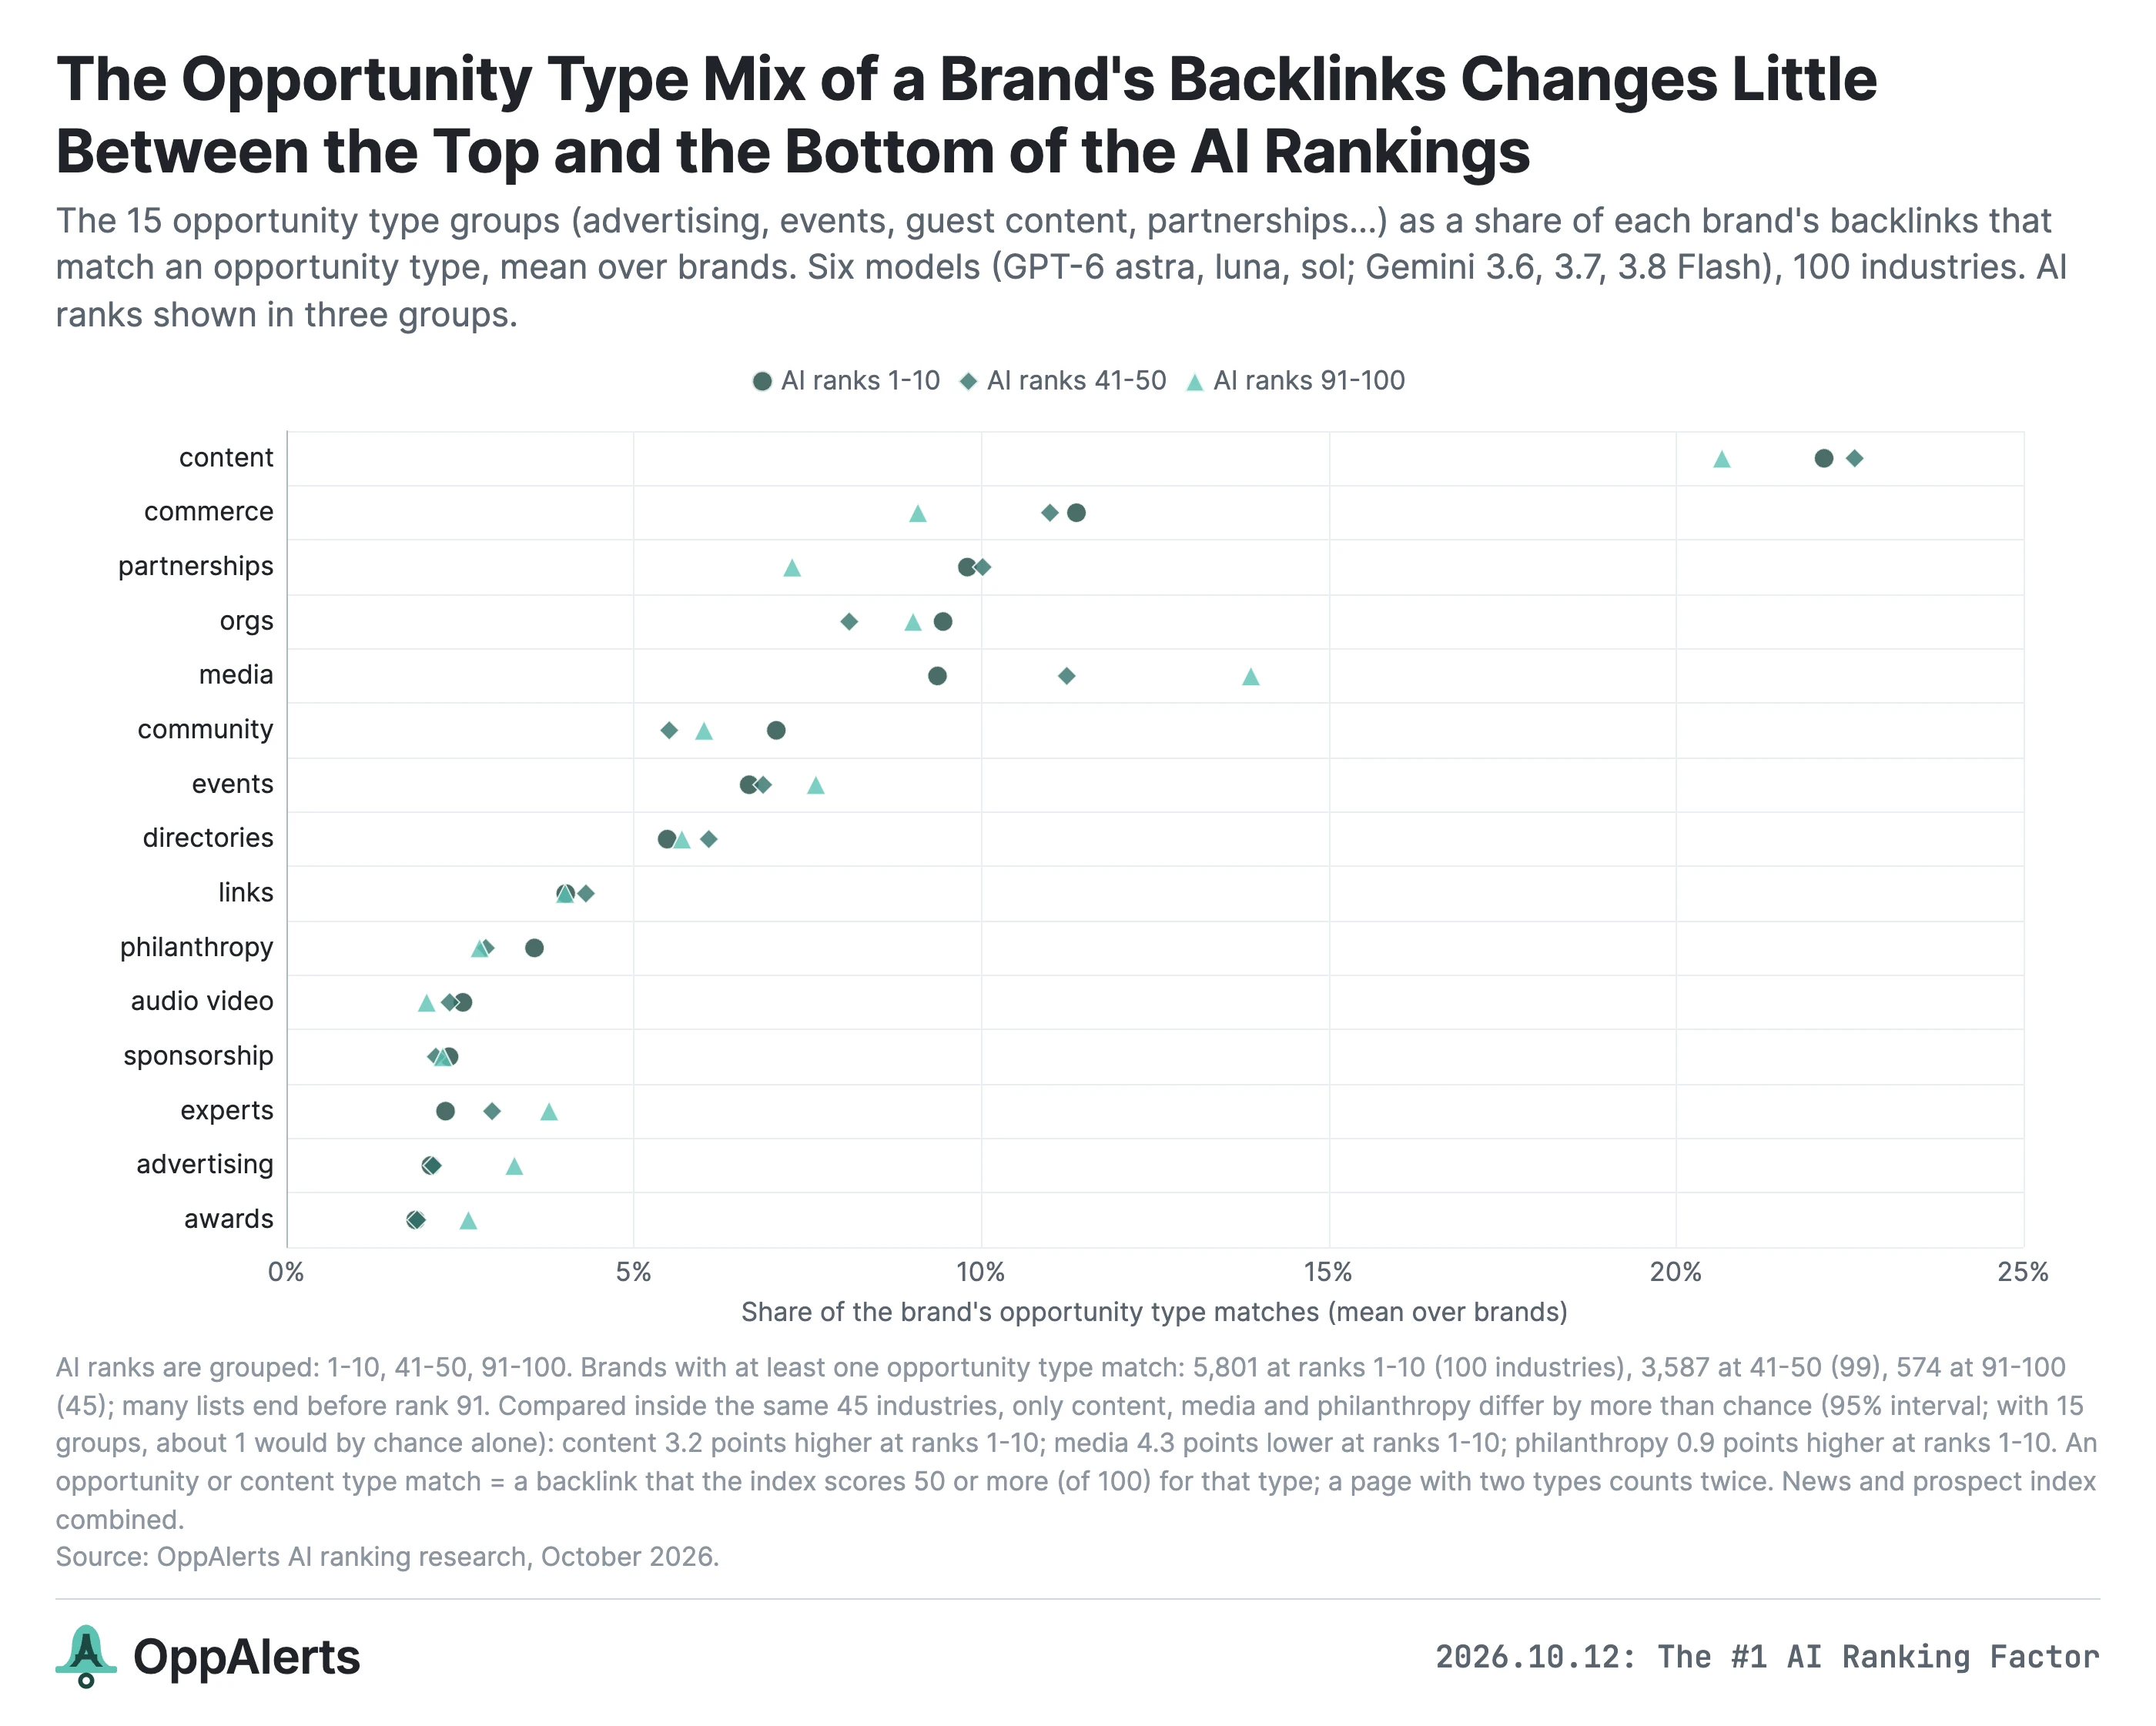
Across the 15 broader groups, only two differences between ranks 1 to 10 and ranks 91 to 100 passed the significance test. Content pages were 3.2 percentage points higher at the top, and media pages 4.3 points higher at the bottom. Testing 15 groups also gives us more chances to find a difference by chance; about one would be expected here.21
The mix changes very little between models, too. Comparing three older OpenAI models with the three GPT-6 models, the largest difference in any group is 1.2 percentage points, even though only 39.5% of GPT-6's recommended brands appear in any of those older lists. Between GPT-6 and Gemini Flash, the largest difference is 0.63 points.
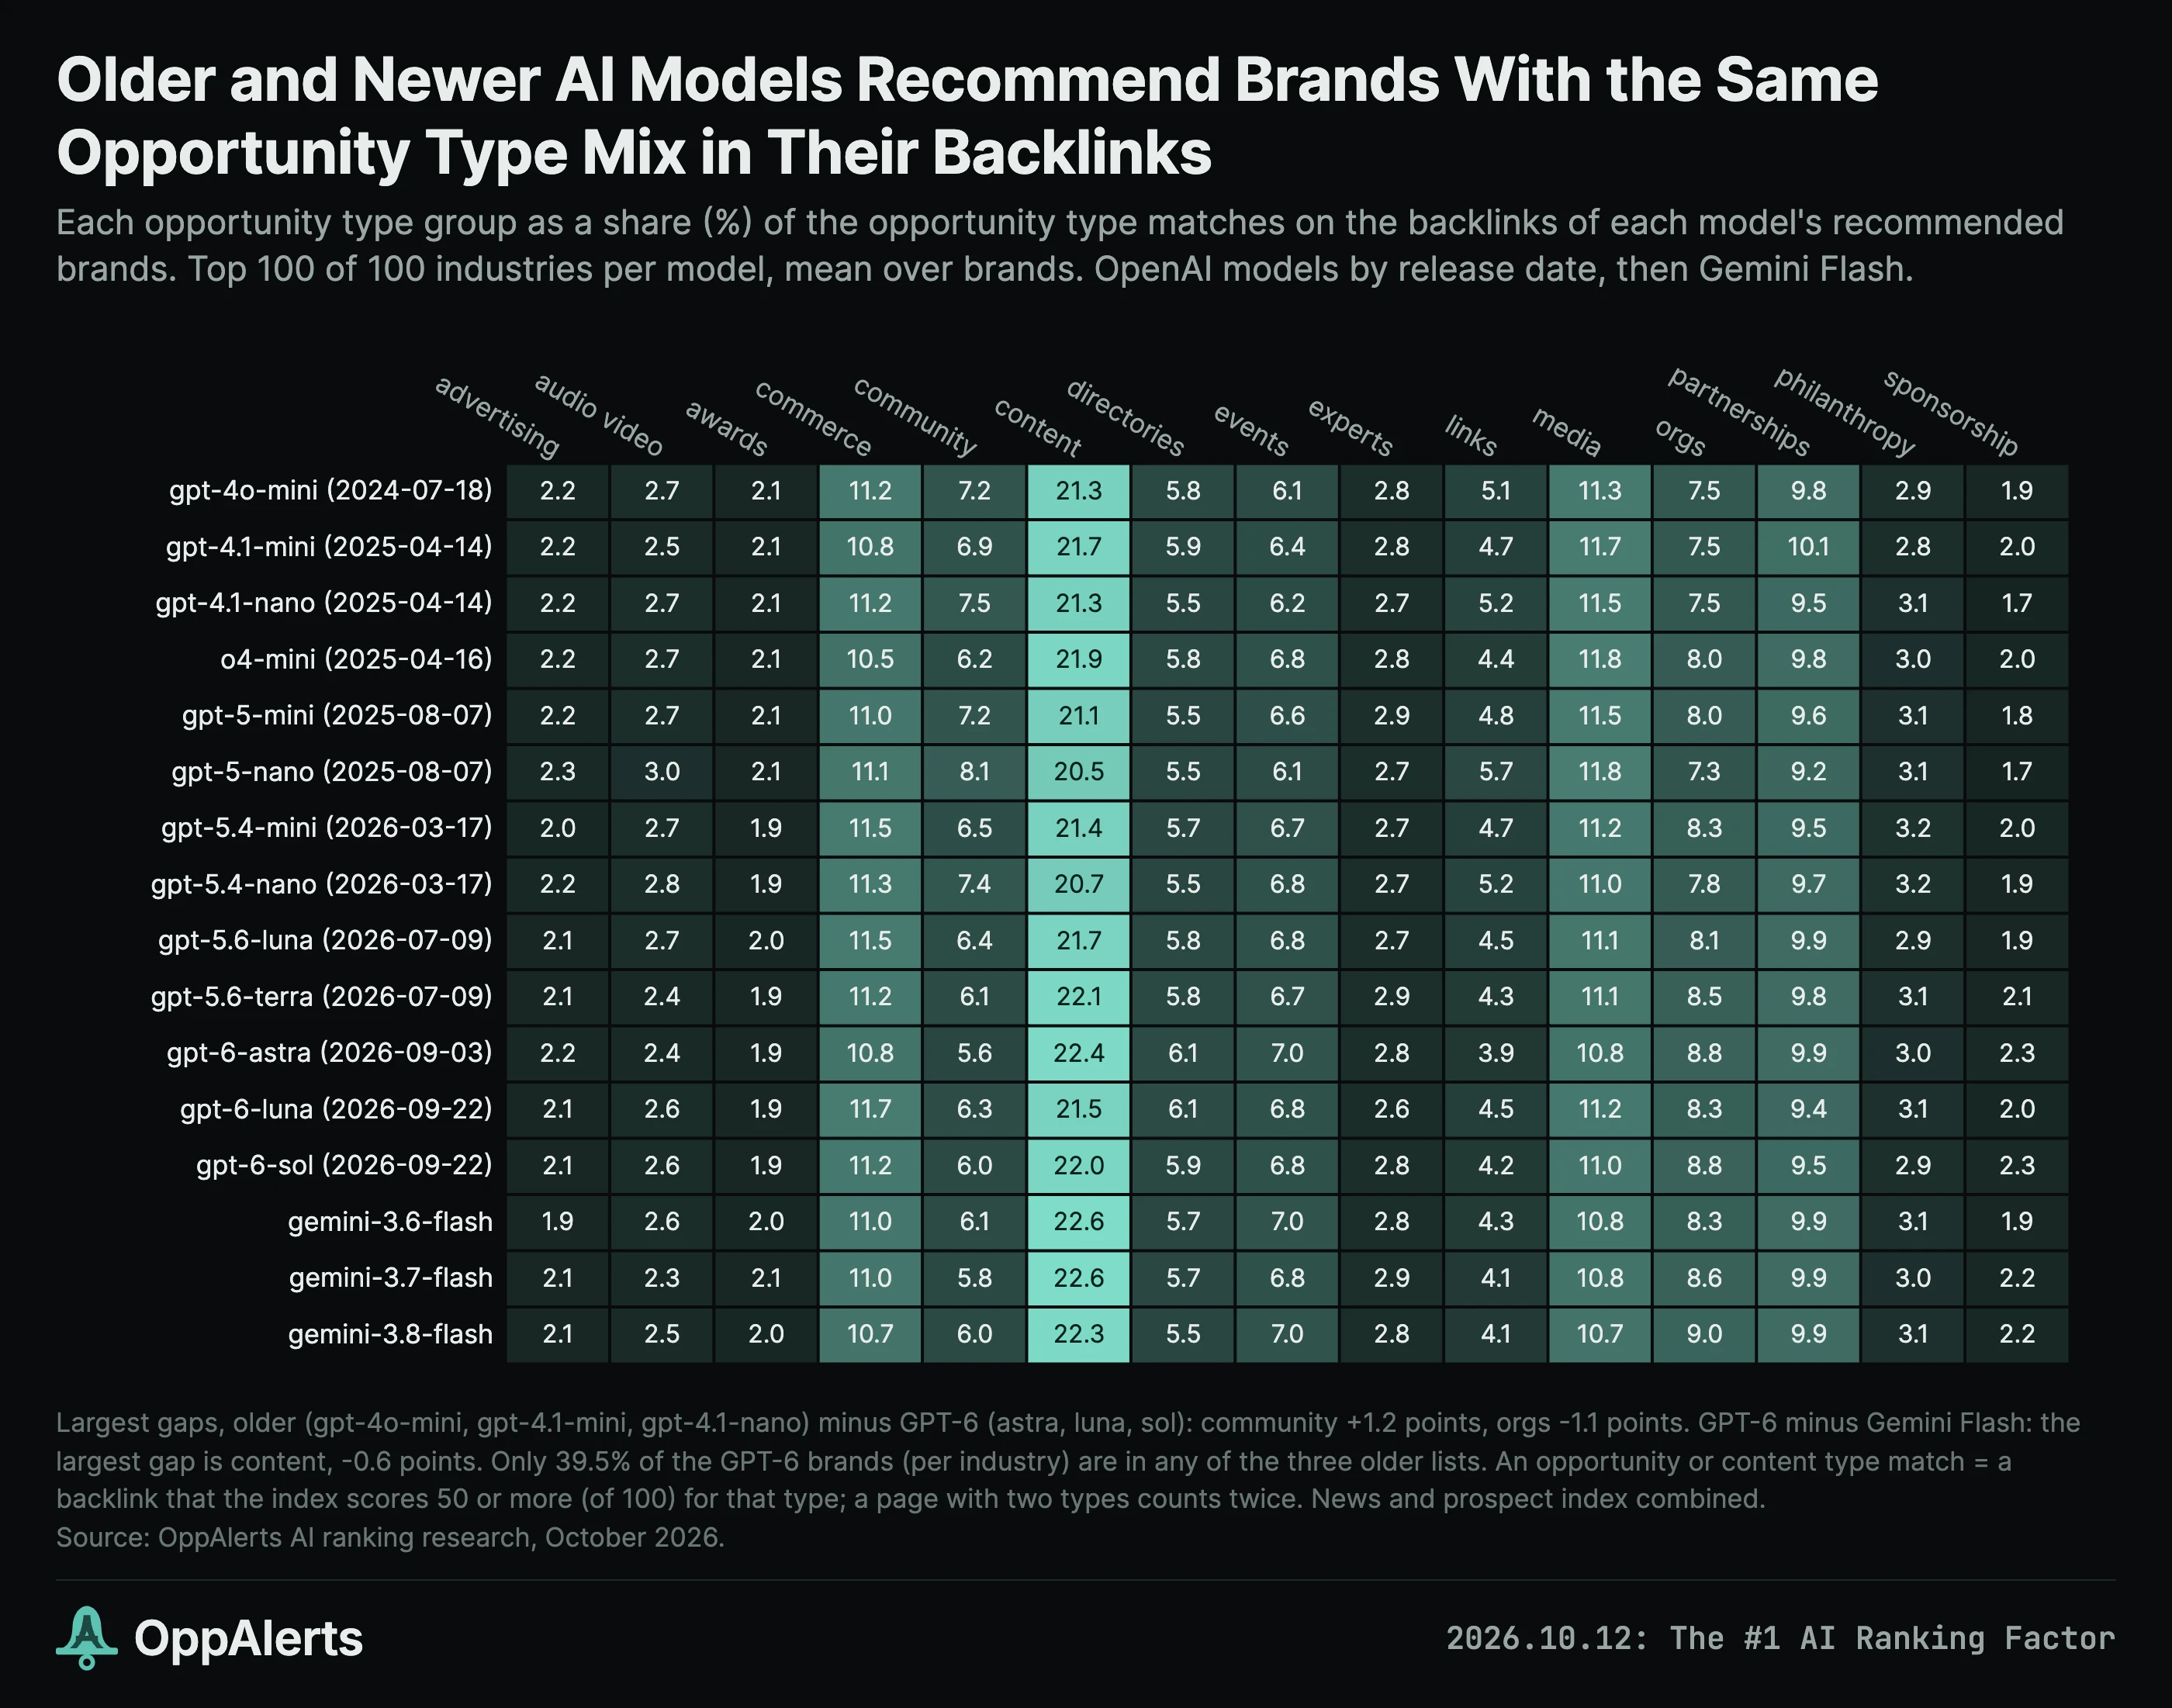
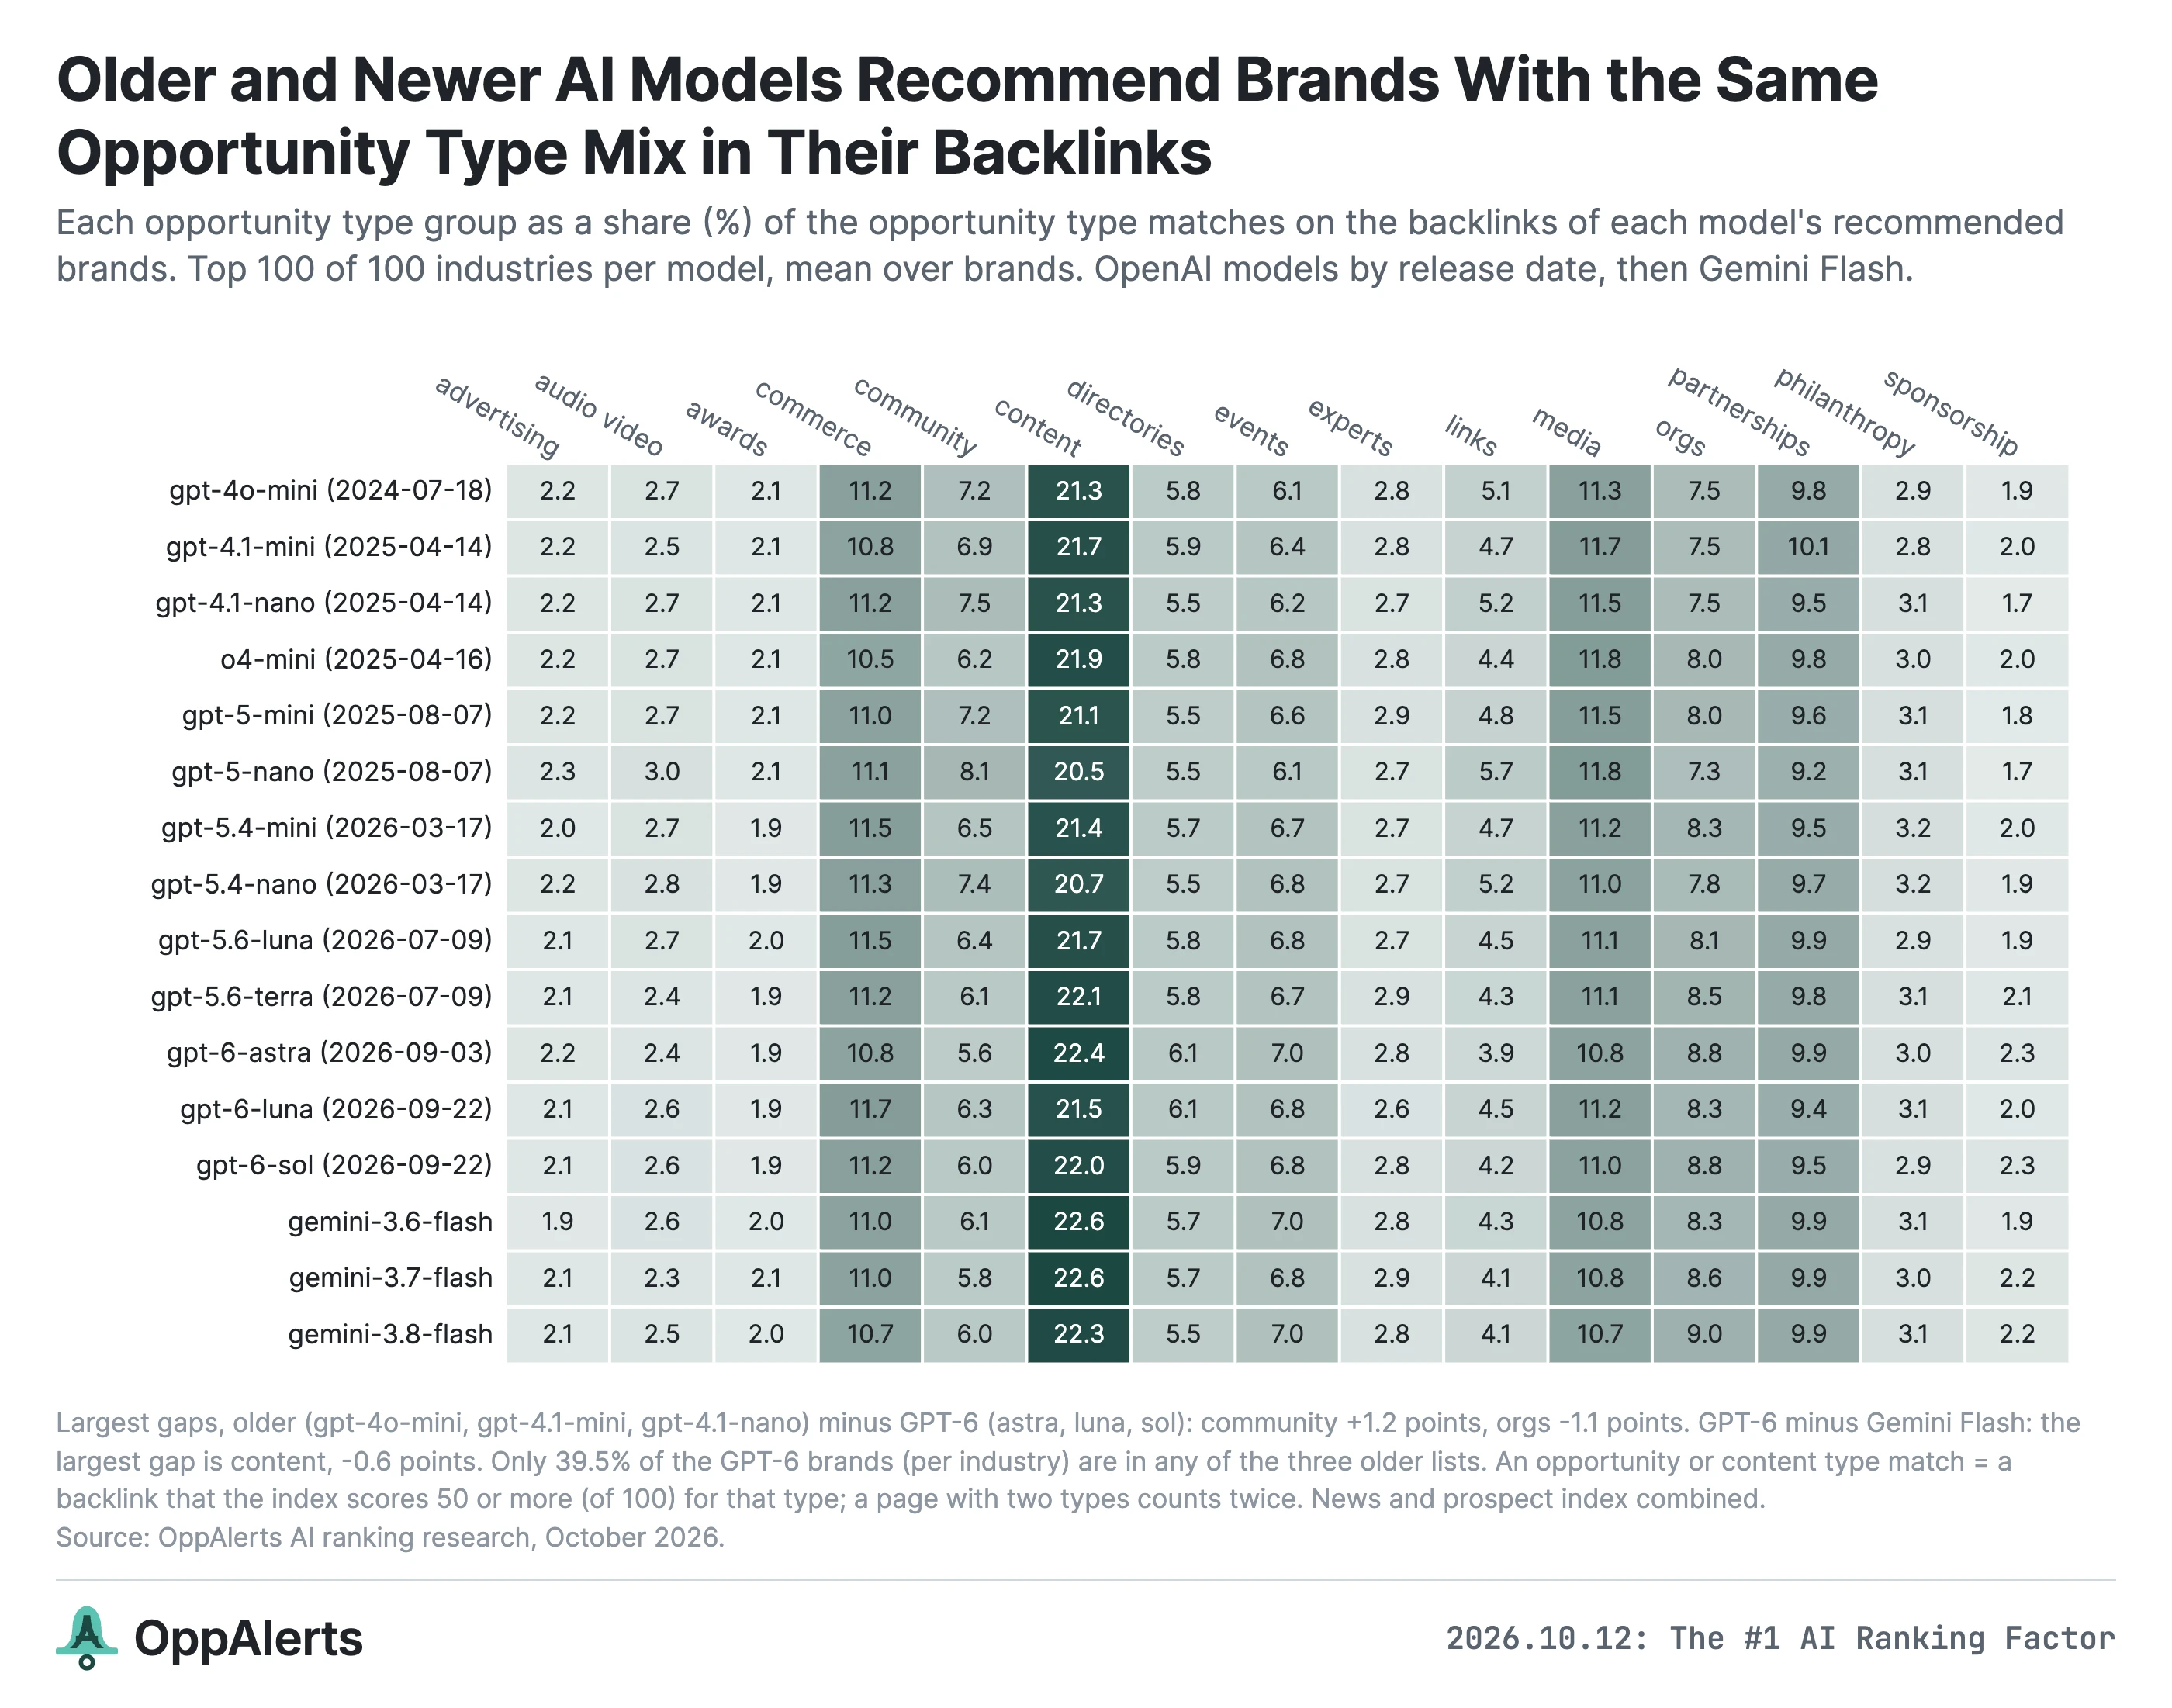
The industry makes a much bigger difference.
Partnerships are 51.5% of the mix for influencer-marketing platforms, compared with 9.2% overall. Audio and video pages are 42.7% for streaming video services, compared with 2.7% overall. Listicle inclusion is the most common individual opportunity type in 79 of the 100 industries.
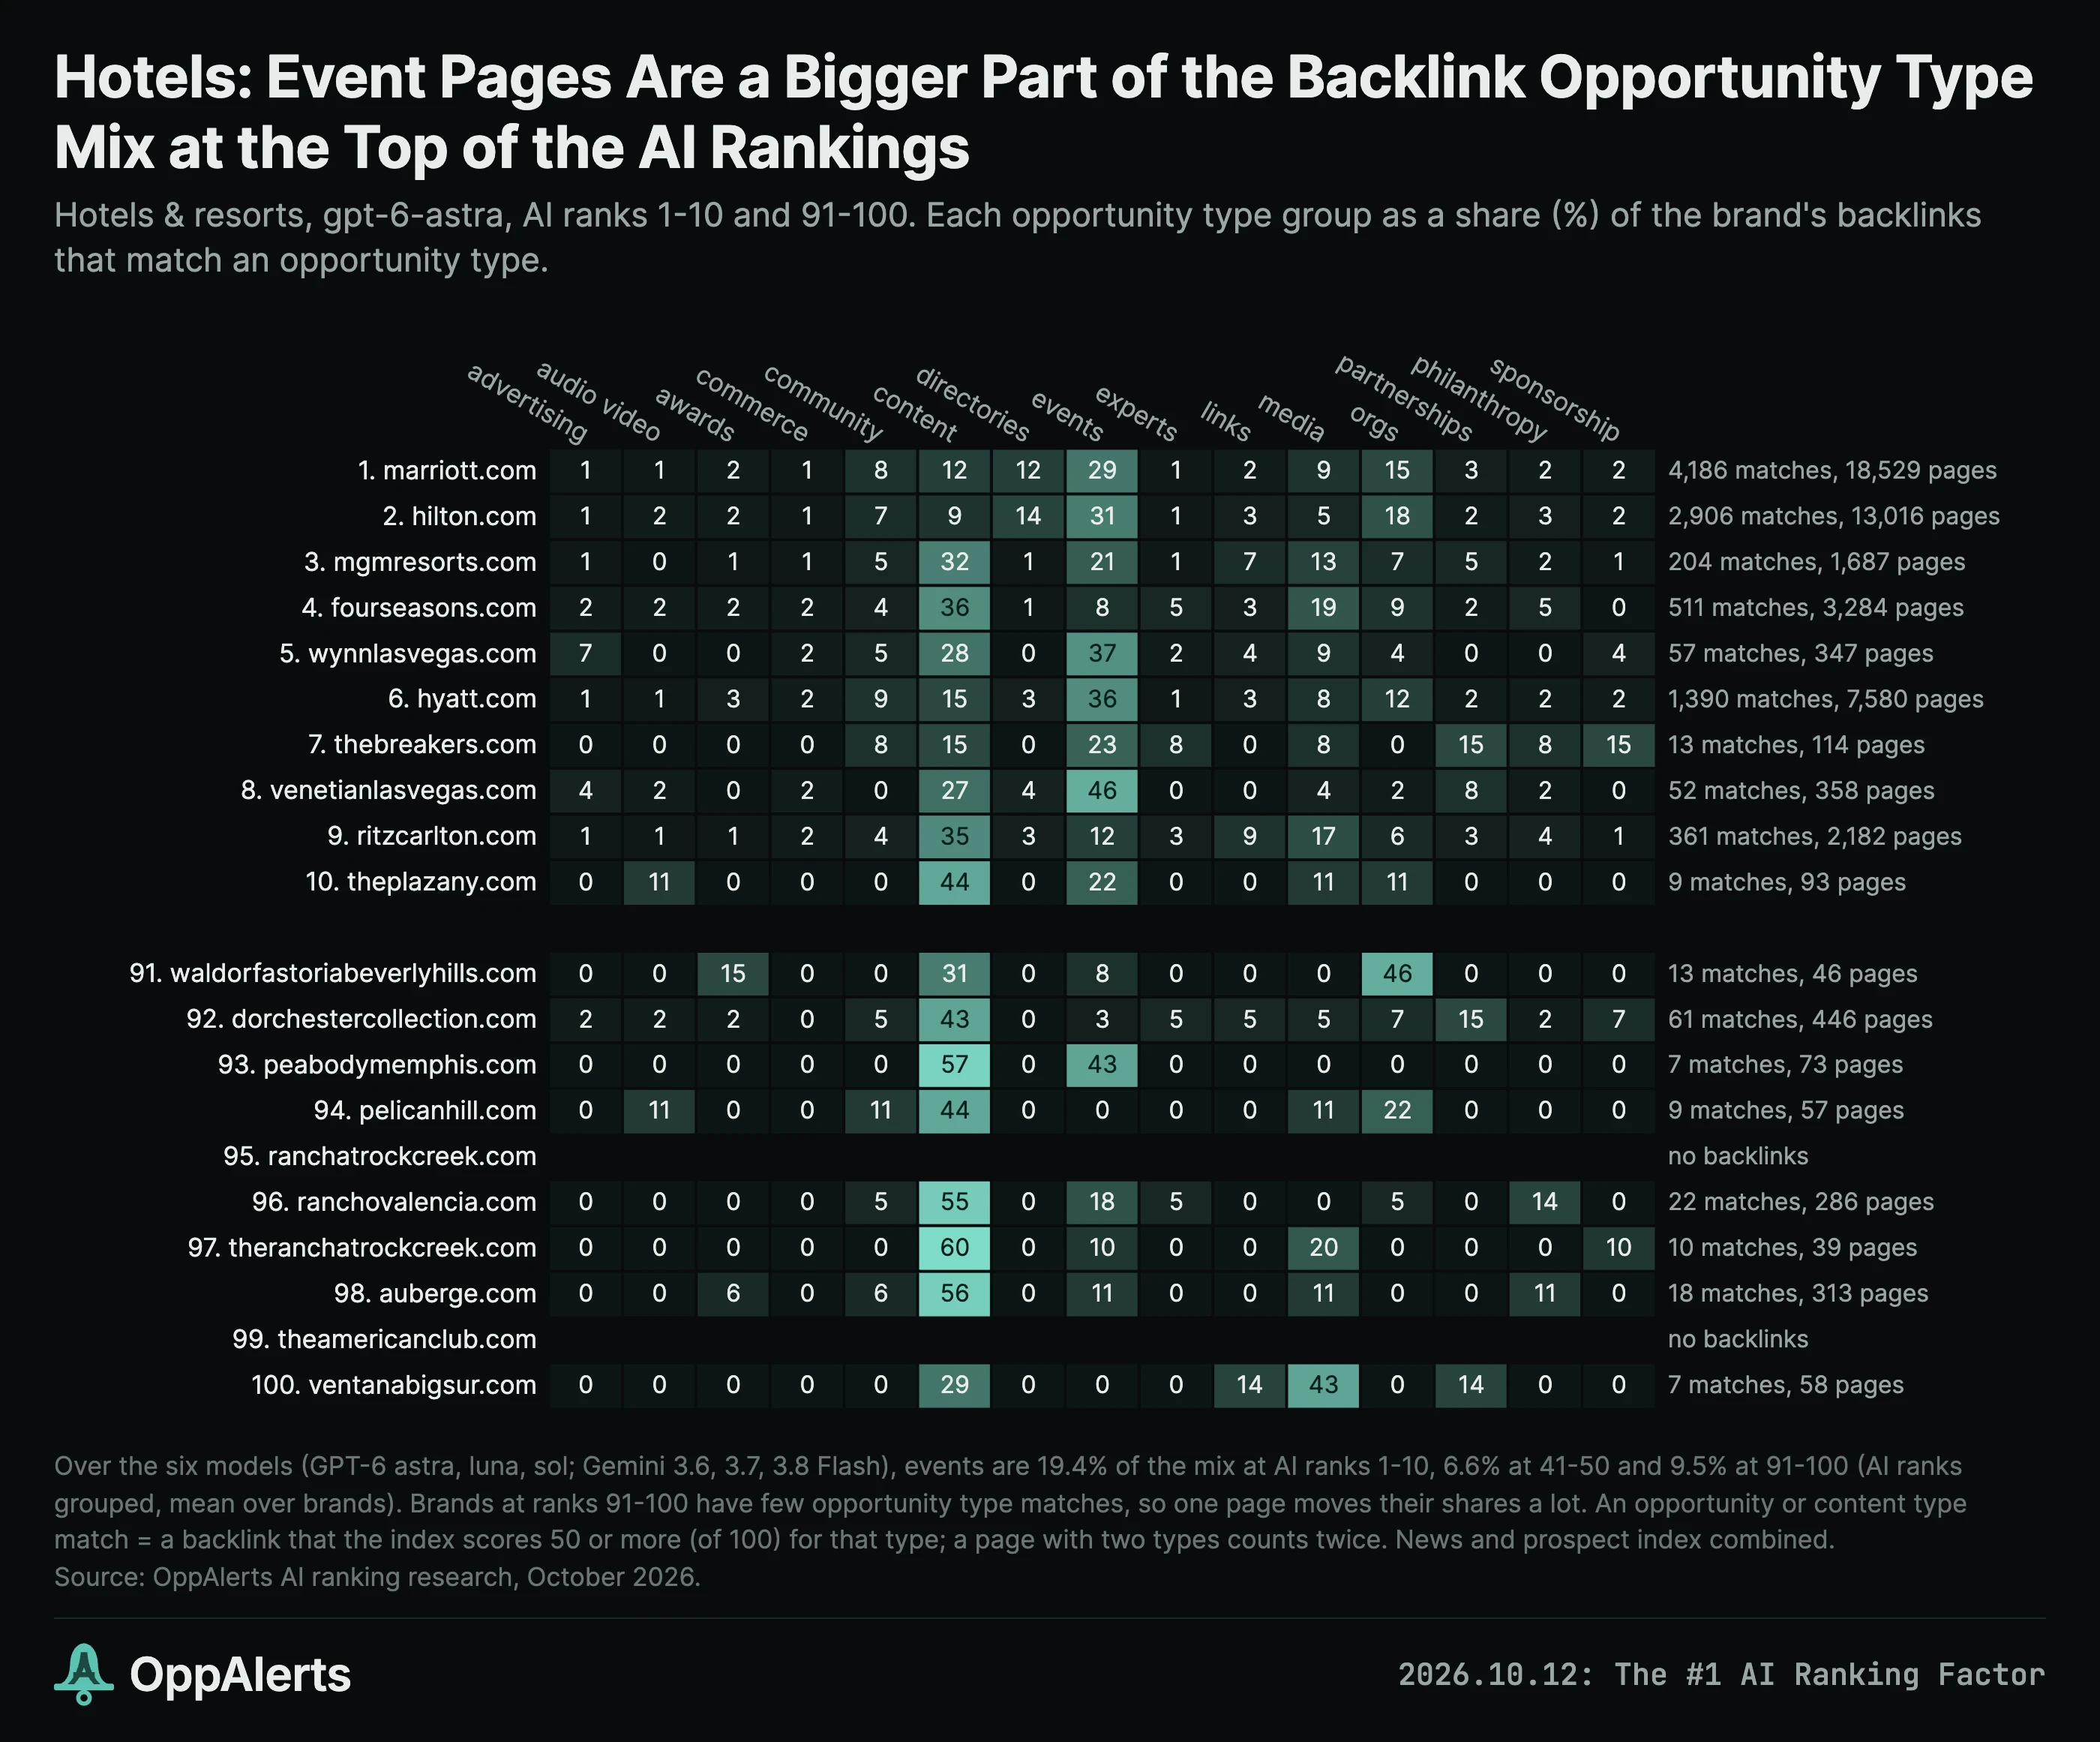
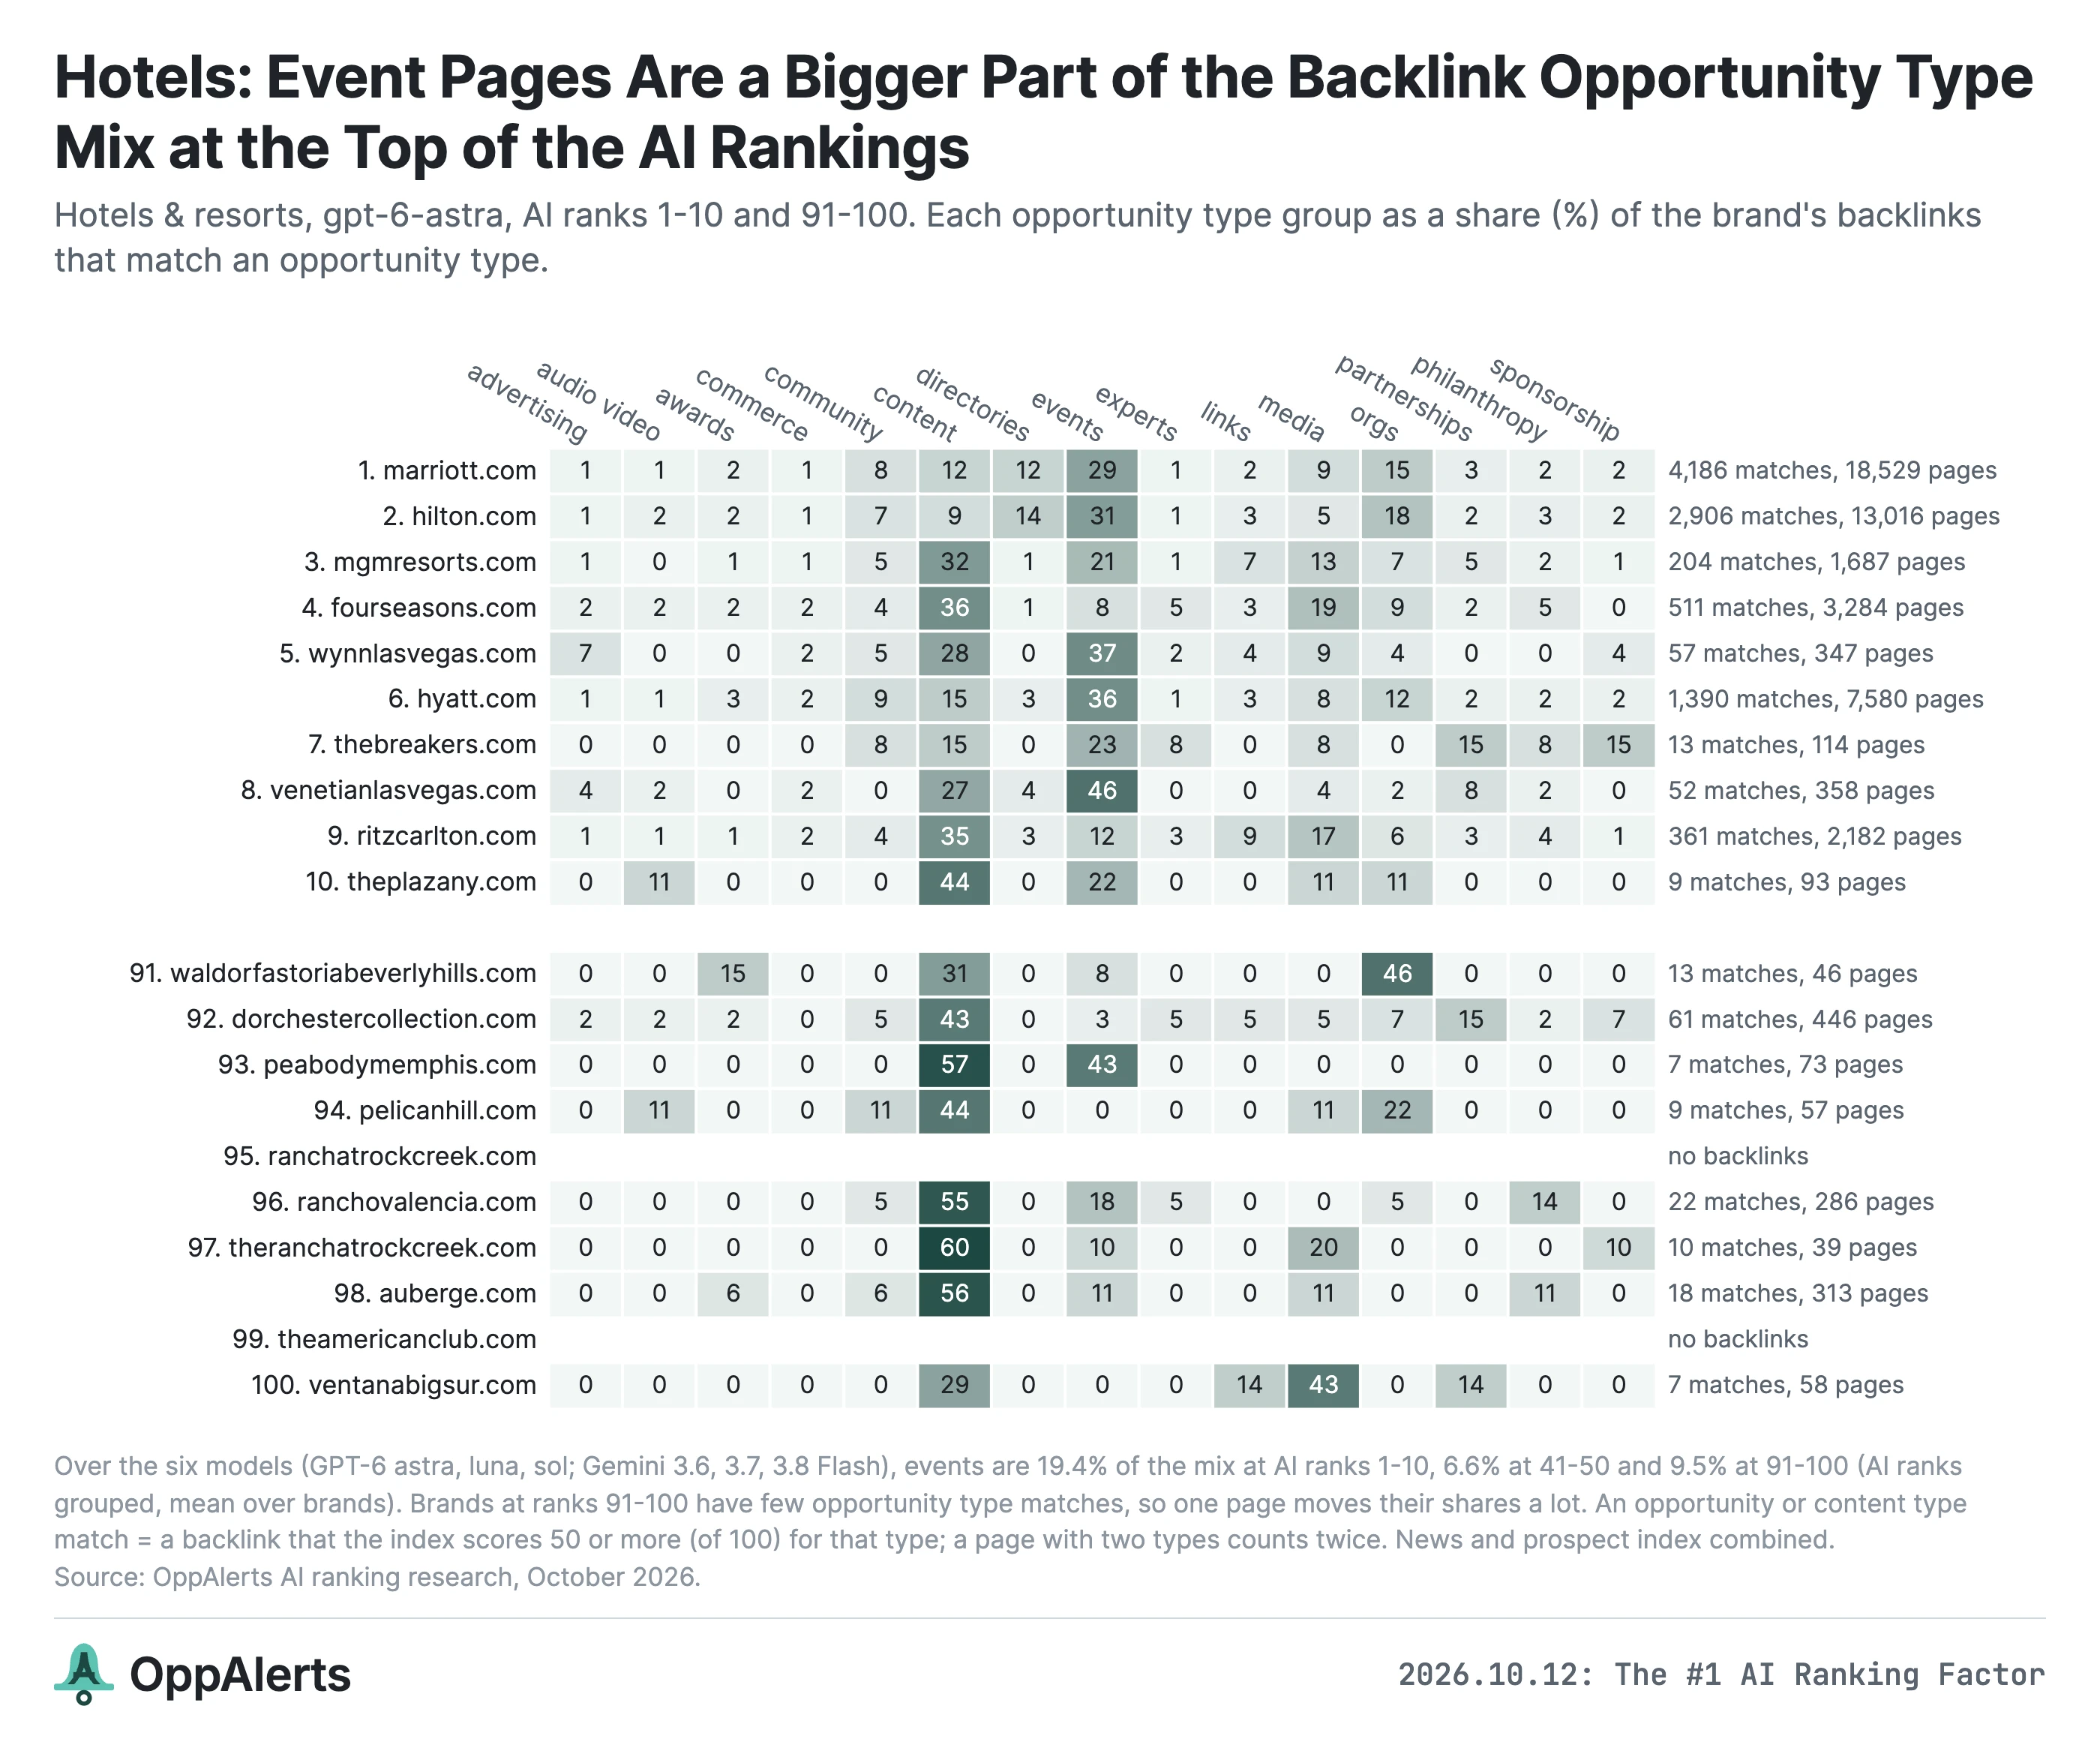
For hotels, event pages are 19.4% of the mix at ranks 1 to 10, compared with 6.6% at ranks 41 to 50, across the six models. For Marriott, Hilton, and Hyatt, events make up 29% to 36% of the backlinks with an opportunity type assigned. Marriott has 798 conference and trade show pages.
Hotels host events. It makes sense that events are part of what links to them.
The opportunity and content types also help identify where brands get mentioned without links. Resource pages are 2.2 times as common among backlinks as among unlinked mentions. Award ceremony pages are about three times as common among unlinked mentions, and case studies and testimonials about twice as common.
There are limits to this part of the analysis. These are OppAlerts classifications, using a threshold of 50 out of 100 to count a page as an opportunity or content type. Most backlinks don't meet that threshold for any opportunity or content type. The share that matches at least one is between 1.5% and 4.1% in the news index, and between 5.1% and 20.6% in the prospect index. A page can match more than one type, so these counts give us a range rather than an exact percentage.
And I choose which opportunities the prospect index looks for. It keeps roughly the top 1% of pages analyzed: about a billion pages analyzed for every 10 million added. It's a selected set of marketing opportunities.
I would use these classifications to find opportunities that make sense for your industry. Then look at the content of each page and how relevant it is to what you want to be known for.
What I'm confident about, and what this test doesn't settle
In the video, I said I believe the relationship is causal. That's my view. The consistency across industries, models, and taxonomies is why I would put contextually relevant backlinks at the center of an AI search campaign.
But I want to be clear about what I actually measured.
I compared brands as they are. I didn't add links to a brand, hold everything else constant, and measure how its AI rankings changed. Repeating the pattern across 21,600 curves doesn't turn this into that experiment.
What we have is a consistent pattern in the context of the pages, a positive relationship between relevant backlink counts and AI scores in all 100 industries for GPT-6 Astra, and similar relationships across the other models.
That's enough for me to act on. It doesn't give me a formula for how many links will move a particular brand a particular number of positions.
A few other details matter when you use the numbers:
- The indexes cover part of the web. They're large, but they're selected. A business with few pages in these indexes can have plenty of coverage elsewhere.
- The largest brands are sampled for similarity scoring. For 242 combinations of brand and index, I scored the first 50,000 pages. The full page counts are retained.
- Mention searches cover 44,600 brand names. Brands that weren't searched are excluded, rather than counted as zero. Common words and phrases make some names difficult to measure.
- PageRank is measured at the domain level. A brand on a subdomain gets the parent domain's PageRank. The 31,400 domains without PageRank records count as zero in correlations and are excluded from medians.
- Relevance uses a threshold. A z-score of 2 is the cutoff for the relevant-page counts. A different cutoff would change those counts. Total link counts, which don't use that cutoff, have correlations only 0.02 to 0.04 lower.
- The lists differ in length. For GPT-6 Astra, medians beyond rank 29 cover fewer than 100 industries. Deep ranks need to be read with that in mind.
- These are broad industry prompts. They don't test every persona, location, price range, or individual user's context.
How I would use this in an AI search campaign
Get the whole marketing team on the same page
You can put an SEO person or team in charge of coordinating this. But you need the rest of the team involved too: content marketing, link building, PR, branding, reputation monitoring, competitive analysis, and business development.22
Everyone needs to understand what you're trying to be known for and who you're trying to reach.
A hotel looking for business travelers, a luxury resort, and a place to stop overnight on a road trip are serving different needs. “We want to rank for hotels” doesn't give the team enough direction.
In my earlier research, I asked for hotel recommendations for someone flying to Los Angeles to buy a car. Changing the car from a Civic to a BMW or a Ferrari changed the recommendations.23 The details in the question matter.
So get clear on the people you want to reach, the problems you solve for them, and the messages you want the rest of the web to associate with your business.
Then make sure the people writing content, finding links, pitching stories, and monitoring the brand are working toward that same thing.
That's why I built OppAlerts around campaigns. You describe your business, the buyers you want to reach, your brands and competitors, and the opportunities you're looking for. Your team can use that same campaign for research, monitoring, and prospecting.
Start measuring the context of your links and mentions
A backlink report that only counts links leaves out the part that had the strongest relationship with AI rankings in this research.
Look at the content of the pages linking to you. Look at the pages linking to your competitors. Figure out how closely those pages relate to your industry and the subjects you want to be known for.24
Do the same with brand monitoring.
This is why I keep using Four Seasons as an example. A keyword monitor can find the exact phrase and still return content about music or sports. Semantic similarity lets you bring the hotel and travel content to the top.
OppAlerts already does this. It monitors news, blogs, podcasts, and marketing opportunities for your brand and competitors, including mentions with and without backlinks. You can monitor specific terms and phrases, then filter the results by how semantically relevant the content is to your industry.
Your content team can also use the semantic content optimizer to see which taxonomy categories a draft is closest to and get suggestions to improve it. You can check a prospective linking page the same way.
Build relationships around relevant opportunities
When you find a relevant page mentioning your brand, reach out. If there's no link, ask whether one would help their readers.
When you find a relevant page linking to a competitor, look at why that competitor is included. There may be a relationship worth building with the publisher, a product worth getting reviewed, or an event worth participating in.
Keep looking for those opportunities over time.
The research gives us a reason to prioritize the number of backlinks from contextually relevant pages. It doesn't suggest that one particular mix of guest posts, events, resource pages, or sponsorships is the answer for every business.
With a paid OppAlerts account, you can search the indexes, get results a thousand at a time, and sort by PageRank or how established a site is. You can also filter by semantic relevance and the kinds of opportunities you want: guest posts, product reviews, events, sponsorships, podcast interviews, etc.
The LinkGap tools let you find and monitor semantically relevant pages linking to two or more competitors. Your campaign keeps looking for new mentions and opportunities, so you have a steady stream of pages to review and people to reach out to.
Set your goals based on your competitors
The top brands in CRM software and cosmetic dentistry have very different amounts of relevant coverage.
Use your industry's numbers. Look at the gap between your brand and the brands being recommended. Look at the topics where those brands have coverage and you don't.
Campaign research in OppAlerts shows which brands AI recommends, the sites it mentions, and the search results your buyers see. From the campaign dashboard, you can track prompts and keywords, compare your visibility with competitors, and follow your links and PageRank over time.
And measure your progress across repeated prompts and more than one model.25 The current OpenAI and Google models agree on much of their top 10, but they don't give identical answers.
I would plan the work as an ongoing investment in relevant content, relationships, links, and mentions. The PageRank history shows how established today's leading brands already were. Building that kind of presence takes time and consistent work.
This is also where the charts become useful outside the SEO team. Put them in front of the people deciding the budget. Show them the relevant coverage your competitors have, the opportunities you're finding, and what the team needs to pursue them.
That's a much more concrete conversation than asking for an AI budget without knowing where it should go.
You can start with a free OppAlerts account for monitoring, alerts, and the content optimization tool. Free and paid accounts also include API and MCP access, so you can use the tools from ChatGPT and Claude Code.
Get your team together, get clear on who you're trying to reach, and start building the relationships that put your brand in the right context.
Appendix: the calculations
For anyone who wants the technical definitions behind the charts:
- AI score: the sum of 1/position across one model's 25 answers for an industry. A domain appearing twice in one answer counts once.
- Within-industry correlation: Spearman correlation between AI score and the measure being tested, using up to the top 100 brands in an industry's list, then averaged across the 100 industries. Model comparisons use the top 25.
- Partial correlation: the same comparison after removing the part explained by another measure, using a linear fit on the ranks within each industry.
- Relevant backlink: a backlink from a page whose cosine similarity to the industry's own category is at least two standard deviations above its mean similarity across the taxonomy's categories.
- Profile alignment: Pearson correlation across a taxonomy's categories, comparing each category's similarity to the industry's category with the brand's average raw score for that category.
- Similarity curve: the average raw score for each category across the brands in a list, with categories ordered by similarity to the industry.
- PRoT: the sum of a domain's PageRank across its records from July 2017 to September 2026. A missing record counts as zero.
- Chart detail: the category charts retain individual categories without smoothing or sampling them. Where ranks or page counts are grouped, the chart identifies the groups.
OppAlerts · Now in Beta
Get the beta price before November 13, 2026.
Every monthly plan is 25% off for as long as you stay a customer.
Ten customers can prepay $6,000 for OppAlerts 1000 through 2027.
Or start with a free account and daily brand alerts.
Let’s discuss how we can work together.
An industry report, a custom dataset, a partnership; a couple of sentences is plenty. Every message comes straight to me, and I read all of them.
If it’s a fit, you’ll hear back quickly with next steps or a time to talk.